EOS price analysis is again in favor of the bulls. The latest updates show that the price has recovered up to $1.109, which is a great improvement considering the past trends and especially yesterday’s plunge. There is a chance that the price may break through the $1.140 resistance level during the next trading session. Although the price has been steadily rising today, there is also negative pressure at play.
1-day EOS/USD price chart: Bears display resiliency hindering the bullish recovery
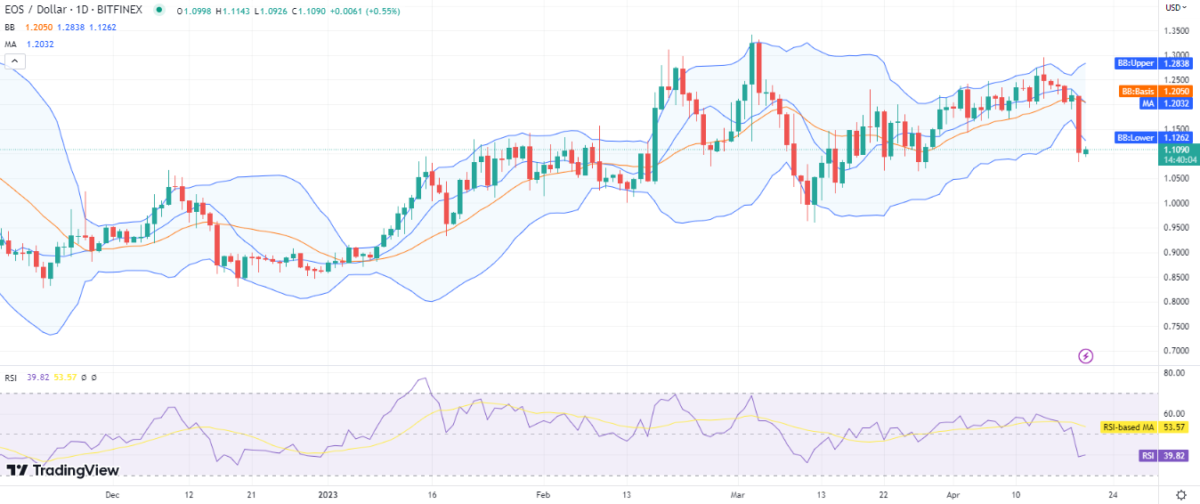
The 1-day price chart showing EOS price analysis informs us of the slow recovery due to the building bearish pressure. The price levels have slightly increased to $1.109 after a slow recovery was observed today. The bearish pressure is hindering the price rise, and due to yesterday’s strong correction, the coin still reports a 1.58 percent loss in value for the past 24 hours. The moving average (MA) has also traveled below the SMA 50 curve to $1.203.

The volatility is also towards the increasing side, and which is not a positive signal for the buyers. Moreover, the Bollinger band average is forming at $1.205, as seen from the chart. The Bollinger bands are expanding, and the upper Bollinger band has reached the value of $1.283 whereas the lower band has reached $1.126 of value. The Relative Strength Index (RSI) score on the other hand seems fairly good at 39 but in the lower neutral range, as the past days have been supportive for the bears.
EOS price analysis: Recent developments and further technical indications
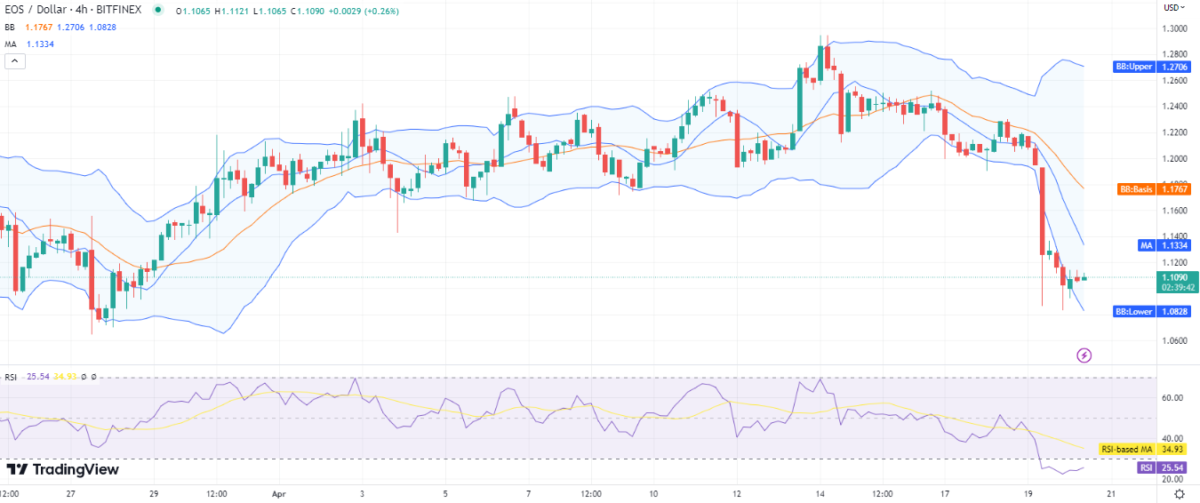
The 4-hours chart for EOS price analysis is showing cryptocurrency progress and hinting at a reasonable improvement in the coin’s value. The most recent analysis shows that the price has increased to $1.109, after overcoming a loss in the last few hours. Previously, the bearish trend was strong as the price plunged below the lower limit of the Bollinger bands, but it has since recovered back above it.

As the Bollinger bands are expanding and their average has decreased to $1.176, the future holds little promise for the bulls. The Bollinger bands values for today are as follows: the upper band is present at $1.270 and the lower band is currently present at $1.082. The RSI curve is trending in the undersold zone at index 25, hinting at the presence of bearish pressure.
EOS price analysis conclusion
From the 1-day and 4-hours price charts for EOS price analysis, it is evident that after suffering a significant loss, the bulls are attempting to rebuild their strength. Today’s price levels have risen to $1.109, and there are optimistic signals that buyers may soon enter the market. The only way to go past the $1.140 barrier level is if the price levels continue to rise at the same rate. This is only feasible if the bulls continue their advance, but with the strong negative pressure today, it may not be doable.


