On-chain data shows more than 70% of the Ethereum supply hasn’t displayed any movement in over a year, a new record for the network.
Ethereum HODLers Now Control Over 70% Of The Asset’s Supply
According to data from the market intelligence platform IntoTheBlock, the total amount of supply owned by the ETH long-term holders has reached a new all-time high.
The analytics firm defines “long-term holders” (LTHs) as the addresses who have been carrying their coins since at least one year ago. Statistically, the longer a holder keeps their coins still, the less likely they become to sell them at any point.
As such, the LTHs are the hands who are the least probable to move their coins. This cohort lives up to this fact in practice as well, as its participants rarely sell no matter what’s going on in the wider market, even if it’s a profitable rally or a deep crash.
Because of this reason, the times the LTHs do sell can be ones to watch, as it suggests that the market has pushed even these diamond hands towards breaking their resolve.
One way to track the movements of the HODLers is through the combined amount of supply that they have kept locked inside their wallets since at least a year ago.
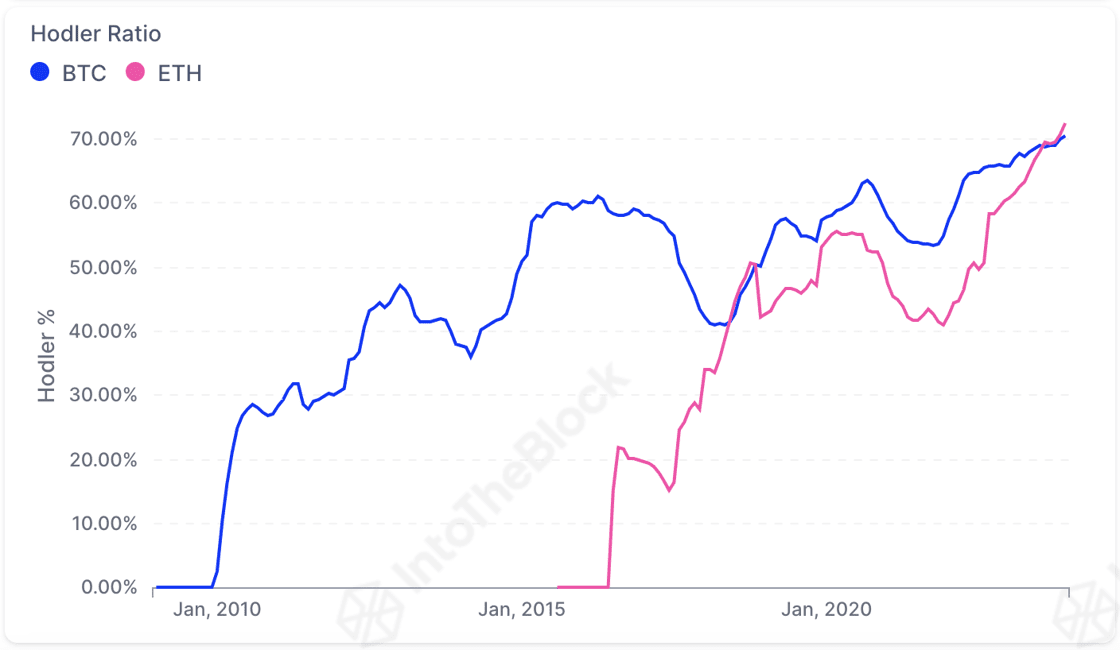
The below chart shows the trend in the LTH supply as a percentage of the total circulating supply for both Ethereum and Bitcoin over the course of the history of the respective assets.
As displayed in the above graph, the supply held by the HODLers has been going up for both Bitcoin and Ethereum recently. Something to keep in mind is that this increase doesn’t indicate that these investors are accumulating in the present.
Rather, what this means is that some buying from the investors took place a year ago and those coins have now stayed dormant for long enough to mature into this cohort.
A year ago, the cryptocurrency sector was still inside a bear market, so the increase in the HODLer supply of the last few months would have come from those who bought at the cheap bear market prices.
It would appear that despite these holders carrying some very substantial profits by now thanks to this year’s rally, they are still not interested in selling, as the HODLer ratio has only gone up for both Ethereum and Bitcoin.
From the chart, it’s visible that the growth in the indicator has been particularly sharp in the case of ETH as it has now outpaced BTC. With more than 70% of the entire circulating supply locked inside the hands of these LTHs, the metric is currently sitting at a new all-time high for the number two cryptocurrency.
ETH Price
At the time of writing, Ethereum’s price is floating around $2,290, up 6% in the past week.


