
Ether’s price is currently trading 25% upside from the eight-month bottom of $2,112 reached on August 5. Peter L. Brandt, an Ethereum crypto trader, made a bold prediction regarding Ethereum (ETH), the leading alternative currency and how far it can fall.
Brandt observes in a post on X that the altcoin’s price will decline to $1651, the lowest it has traded since October 2023.
Over the past seven days, the second-largest crypto by market capitalization has experienced a 13% increase in value. Despite this performance, analysts maintain that Ethereum’s downside risks persist.
In an Aug. 15 post on X, Arete Capital partner McKenna stated, “I don’t really expect $ETH to break above $2800-2900 but rather remain range bound for August and some of September.”
Following the recent drawdown, which was exacerbated by ETH dumping by market maker Jump Trading and concerns regarding a global recession, McKenna discussed Ether’s price action. On August 5, ETH experienced a 21% decline, reaching a swing low of $2,112 before rebounding to its current price of $2,614.
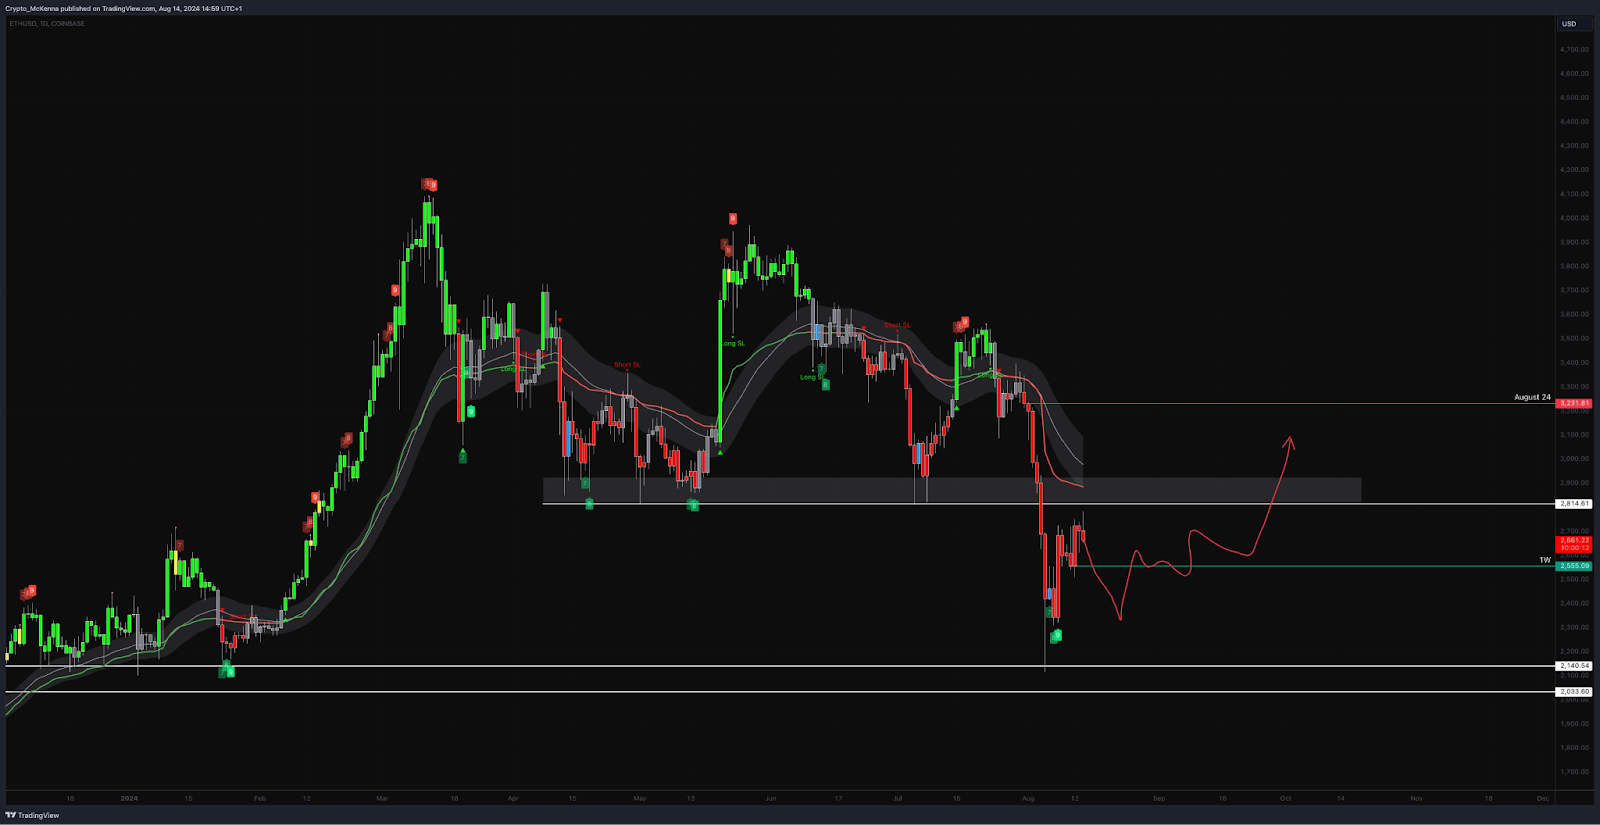
The analyst points out that the supplier congestion zone at $2,800 provided significant resistance to Ether’s ascent to $2,750 on Aug. 12. McKenna stated that they would not be highly convinced to go long on Ethereum from the current levels, as the price is “trading close to this supply.”
Ethereum set to lose its support level at $2,200
At the same time, Peter Brandt, a fellow analyst, stated that Ether’s price action offered two potential scenarios derived from two separate chart patterns: a 5-month rectangle and a rising wedge. In the first case, when the price of Ethereum rose above $2,960, an ideal exit position for longs was presented.
The second standpoint suggested that the ascending wedge would collapse, thereby extending the downward trend. This would result in Ether falling to $1,650, the rectangle’s bearish target.
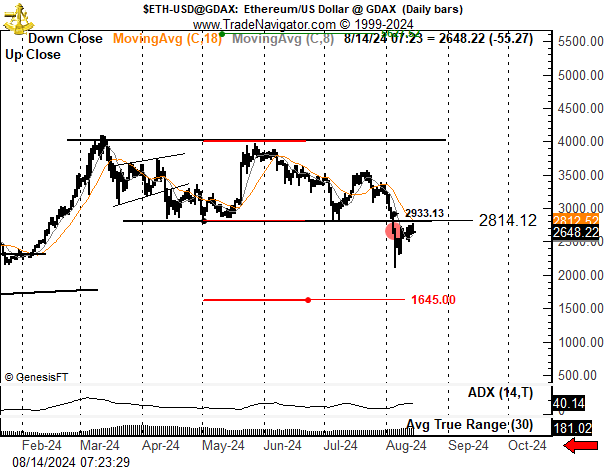
The coin’s consolidation phase closed on August 4, when it dipped below the lower line of the rectangle pattern. Typically, an asset retests the breakout level to ascertain whether it will serve as support or resistance after breaking out of a consolidation pattern.
Brandt asserts that the altcoin is currently retesting this breakout level at its current price in order to determine whether it will maintain or decline.
Additionally, the market analyst sees a rising wedge pattern on an intraday chart. This pattern is established when an asset’s price consistently experiences higher and lower lows, but the distance between them narrows, resulting in a wedge shape. This pattern, which is generally regarded as a negative signal, indicates a potential reversal to the downside.
The coin’s price will continue to decline as it is unable to surpass the level. In light of this information, Brandt started a short position with a target of $1,651. This position provides a risk-to-reward ratio of 3:1.
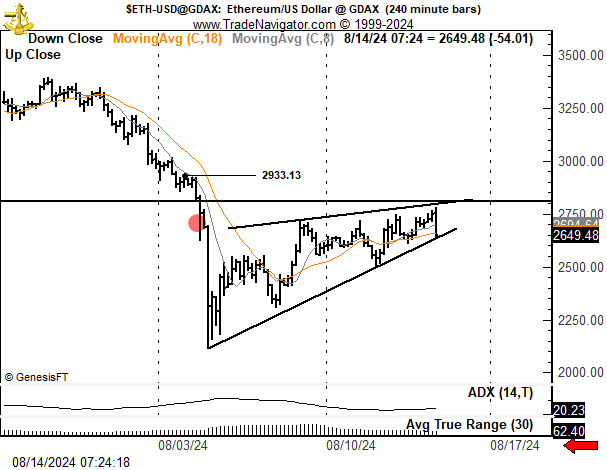
Nevertheless, acknowledging the necessity of caution, he announced that he would set a stop loss at $2,961 and exit the trade if ETH’s price surpassed this threshold.
Glassnode data shows that Ethereum’s funding rates have been consistently positive since the start of 2024, which implies optimistic expectations. However, the recent drop in price to $2,100 was accompanied by a drop in funding rates, which underscored a change in market sentiment.
In general, negative funding rates suggest that short positions outnumber long positions, which suggests a high number of bearish bets.