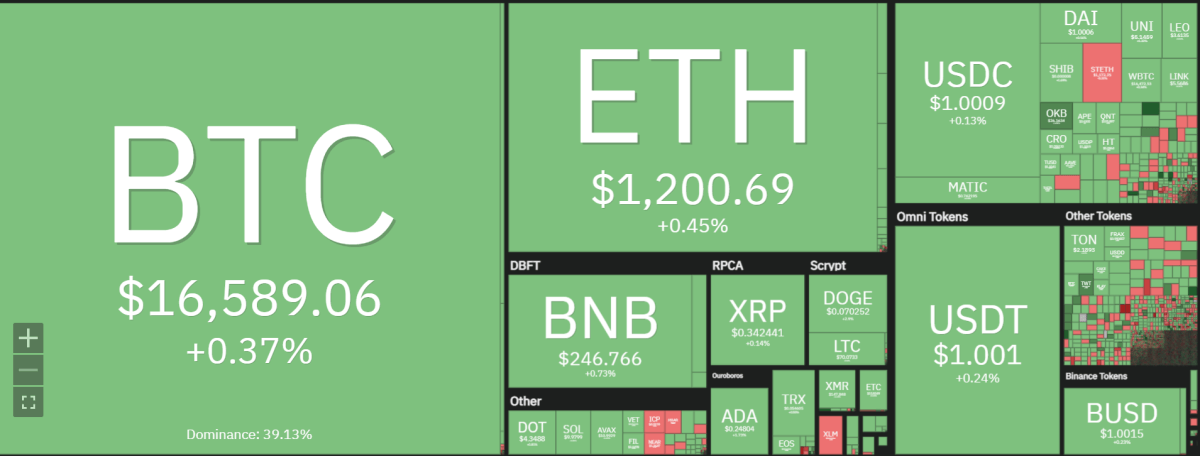
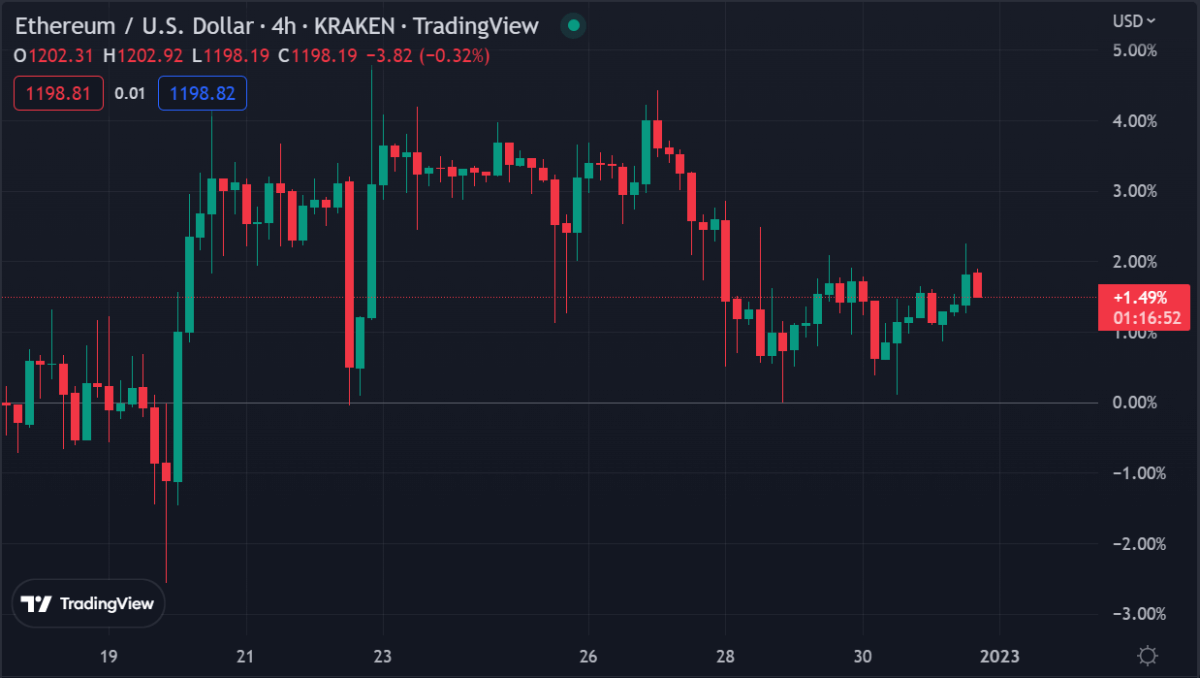
Ethereum price analysis shows ETH is stumbling to remain above $1,200 after reaching a daily peak of $1,204.67.The price of Ethereum is currently trading at $1,200.79, up by 0.40 percent in the last 24 hours. The short-term technical outlook for ETH/USD suggests that a bullish breakout could be imminent. Ethereum is lacking momentum for a clear directional move. ETH prices have been consolidating within an ascending triangle pattern. Currently, the price of Ethereum is trading between $1,100 and $1,200 support and resistance levels respectively.

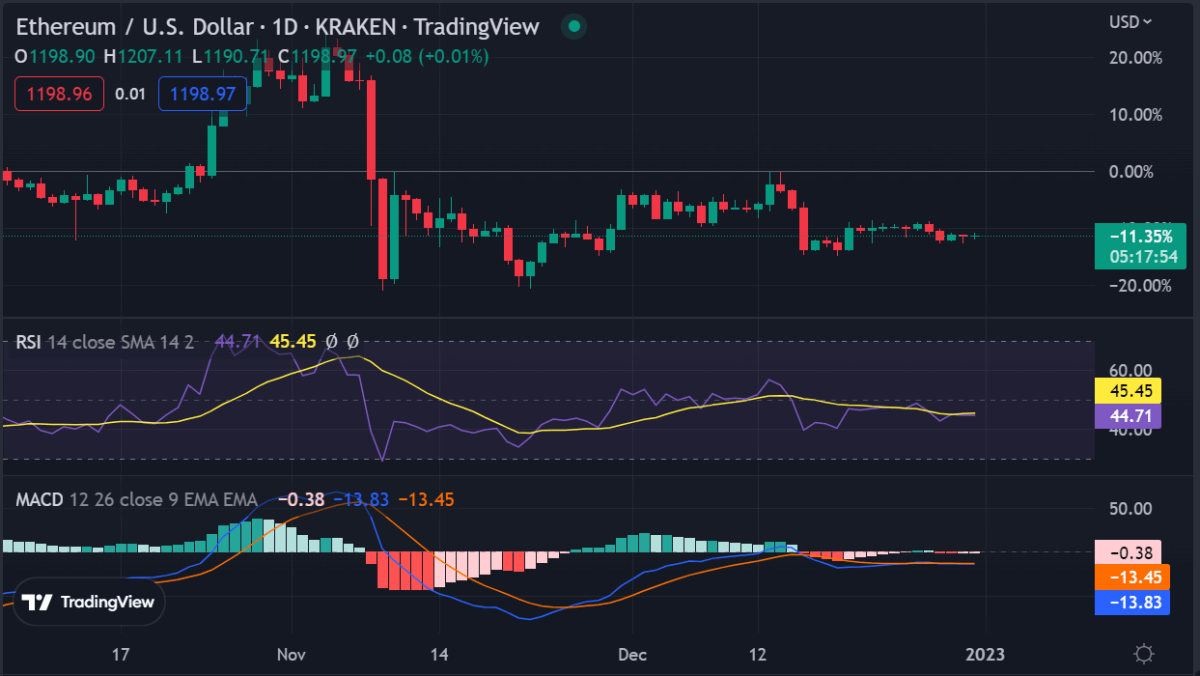
The next significant hurdle for bulls to overcome is the psychological level of $1,200. If bulls can breach this level with a volume of buying, the price could rally toward $1,250 and then higher. The Relative Strength Index (RSI) is currently pushing higher and given a sufficient momentum push Ethereum prices could rally significantly over the coming days.
On the downside, if ETH/USD makes a lower low below $1,100 it may indicate further bearish pressure in the near term. In order for Ethereum prices to rise higher, bulls must maintain an elevated level of buying pressure above $1,200. The overall sentiment still appears to be slightly bullish and the current consolidation phase could lead to an explosive move in either direction.
It will be interesting to see if Ethereum can close out the year on a positive note and push above $1,200 in the next few hours. If Ethereum can sustain its bullish momentum, it could potentially open up a new wave of buyers in the crypto space and possibly allow ETH to reach higher price levels in early 2023.
Ethereum price analysis: ETH remains rangebound in all timeframes
Ethereum price analysis shows ETH has been trading in a rangebound pattern in all timeframes. The weekly chart indicates that Ethereum prices have been trading within a descending triangle pattern since Dec 20. Currently, the price of Ethereum is testing and rejecting the 60-day moving average at $1,200. If sellers can push ETH below this support level it could lead to further downside toward $1,000 or lower.

On the upside, if Ethereum prices can break out of its current triangle formation, it could indicate a significant bullish move in the near term. Bulls need to push ETH/USD above $1,250 in order to signal a sustainable bullish trend.
It appears that Ethereum is caught between bulls and bears at the moment but there is still time for Ethereum to make a move higher before the end of this year. With strong support levels at $1,100 and $1,200, there could be ample opportunity for bulls to push Ethereum prices higher in 2023.
Ethereum has managed to hold above the psychological level of $1,200 for most of the day and this could be indicative of further bullishness in the near future. The Relative Strength Index (RSI) is currently trading in neutral territory and the upcoming market momentum could determine whether Ethereum prices will make a bullish breakout or not.

The technical indicators are showing a low volatile market at the moment and this could be a sign that the current consolidation phase is nearing an end. The Oscillators are trading near the zero line and this could be an indication of further sideways movement in ETH/USD before it makes a clear directional move.
Ethereum price analysis conclusion
Ethereum price analysis for today shows the overall sentiment still appears to be slightly bullish and if Ethereum can close out the year above $1,200, it could open up a new wave of buyers in early 2023. Bulls need to maintain an elevated level of buying pressure above $1,200 in order to sustain the current bull market.
While waiting for Ethereum to move further, see our Price Predictions on XDC, Cardano, and Curve


