Ethereum price analysis shows ETH is trading at $1,663.79 after opening today’s trading session at an intraday high of $1,703.03. Ethereum is trading in a horizontal trend; however, it is facing minor selling pressure and a rejection from the $1,700 resistance level.
Ethereum’s price action in the day has been stagnant. Ethereum is currently in a sideways trend and is looking towards breaking the $1,700 resistance level once again in order to push higher. The trading volume over the past 24 hours is $9,838,361,799, with the market cap standing at $204.2 billion.
Ethereum price analysis on a daily timeframe: Bulls hold their ground despite sell-off
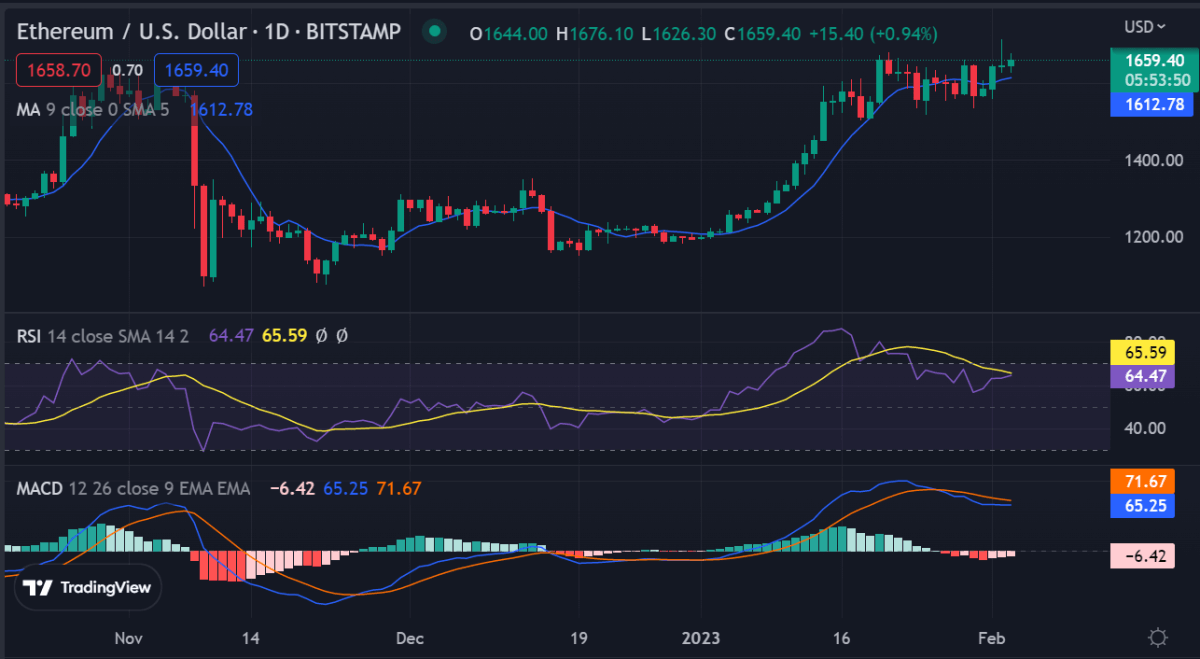
Ethereum price analysis on the daily timeframe shows ETH continues to hold above the $1,600 level. The ETH/USD pair is a range-bound market and trading near its intraday low of $1,643.69. The MACD shows bearish momentum as the 12-period EMA continues to cross below the 26-period EMA. The RSI is also pointing downwards and trending below the 50-level.

Ethereum is trading in a rangebound market with a support level of $1,500 and a resistance level of $1,700. A breakout above the resistance level could lead to further gains and a possible test of $2,000. On the other hand, a breakdown from the support level could lead to losses and further downside.
The bulls are currently in control as Ethereum holds above the key $1,600 level despite the minor sell-off today. A move above the $1,700 resistance level could lead to further gains in the near term. Ethereum is currently trading above all major moving averages, indicating a bullish bias in the market.
The outlook of Ethereum remains positive as long as it holds above the key $1,600 support level. The bulls are looking to break past the $1,700 resistance level in order to push higher. The next major resistance level for Ethereum is at $2,000. A break above this level could open up a path toward the $2,200 handle.
Ethereum price analysis on a 4-hour chart: ETH trades in a tight range
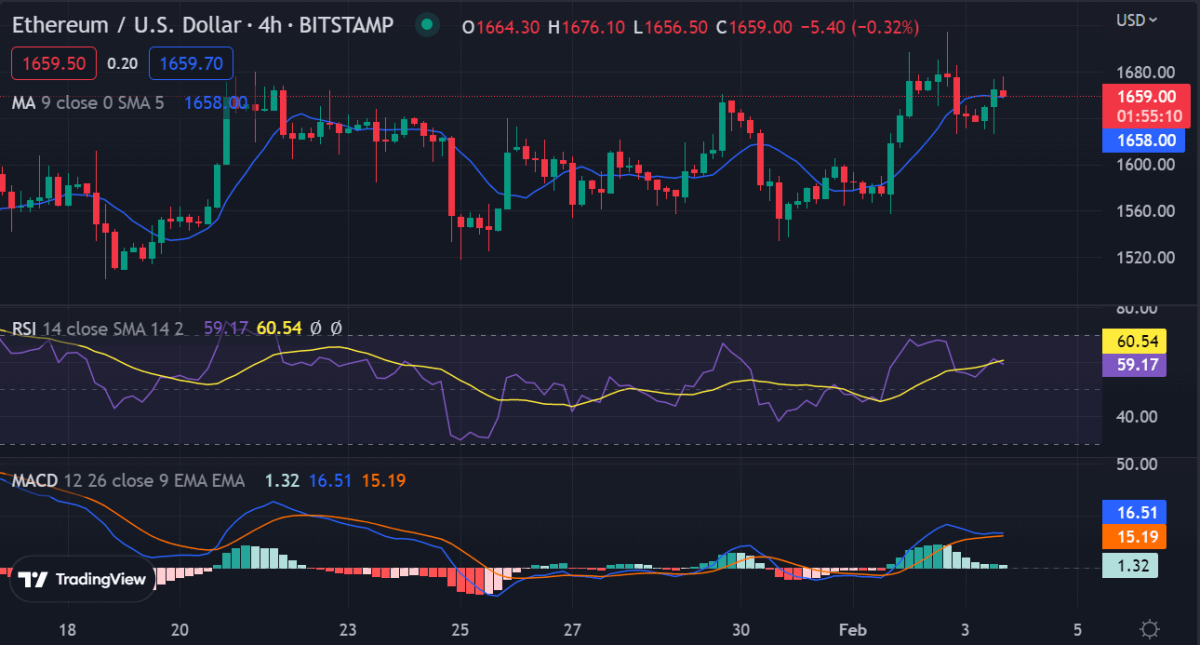
Ethereum price analysis on the 4-hour chart shows ETH trading in a tight range. The MACD is showing bearish momentum as the 12-period EMA crosses below the 26-period EMA. The RSI is trending just above the 50 levels, indicating that the bulls are holding their ground despite the minor correction today.

The key support and resistance levels for Ethereum on the 4-hour chart are $1,620 and $1,755. If Ethereum breaks above the $1,755 resistance level, it could lead to further gains in the near term. On the other hand, if ETH breaks below the $1,620 support level, it could lead to a further decline and a possible test of the $1,500 support level.
The 4-hour chart RSI is trending just above the 50-level, indicating that Ethereum is in a consolidative phase and could be looking toward a breakout soon while the MACD shows bearish momentum. The outlook for Ethereum remains bullish as long as it holds above the key $1,600 support level. A break above the $1,700 resistance level could lead to further gains in the near term.
Ethereum price analysis conclusion
Ethereum price analysis suggests that ETH is trading in a tight range between the $1,620 and $1,755 levels. The bulls are currently holding their ground above the key $1,600 support level despite small corrections today. Ethereum is looking to break past the $1,700 resistance in order to push higher and test the next major resistance at the $2,000 level.
While waiting for Ethereum to move further, see our Price Predictions on XDC, Cardano, and Curve


