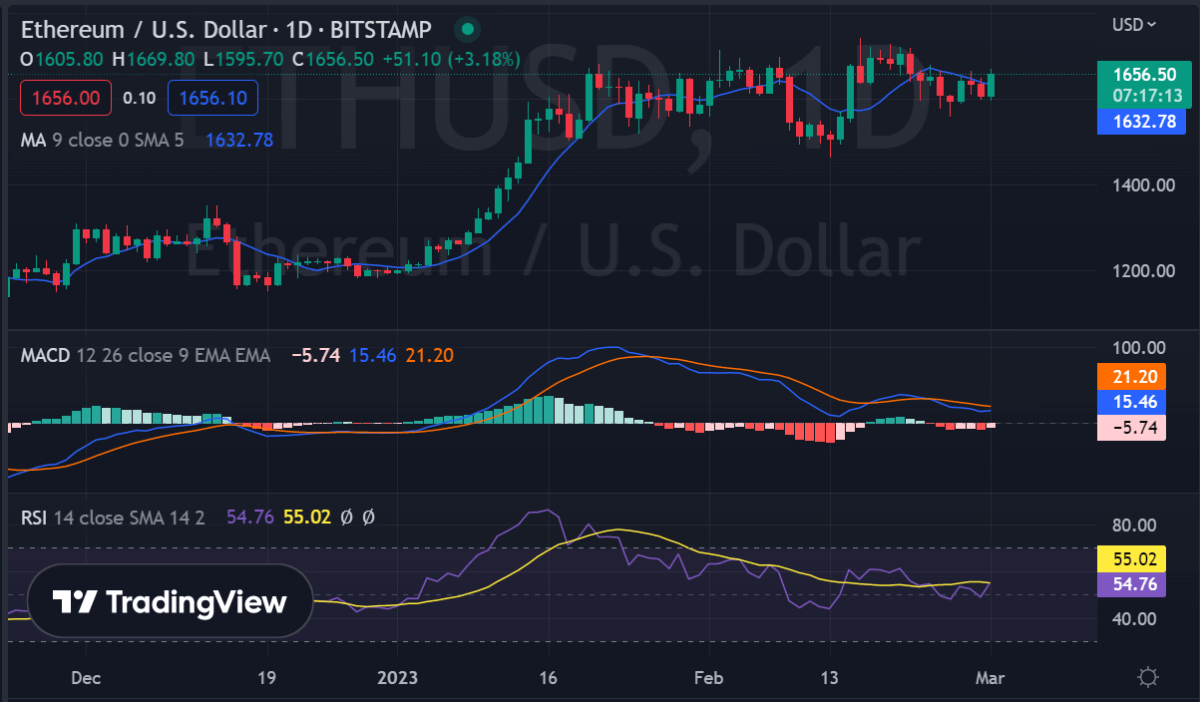
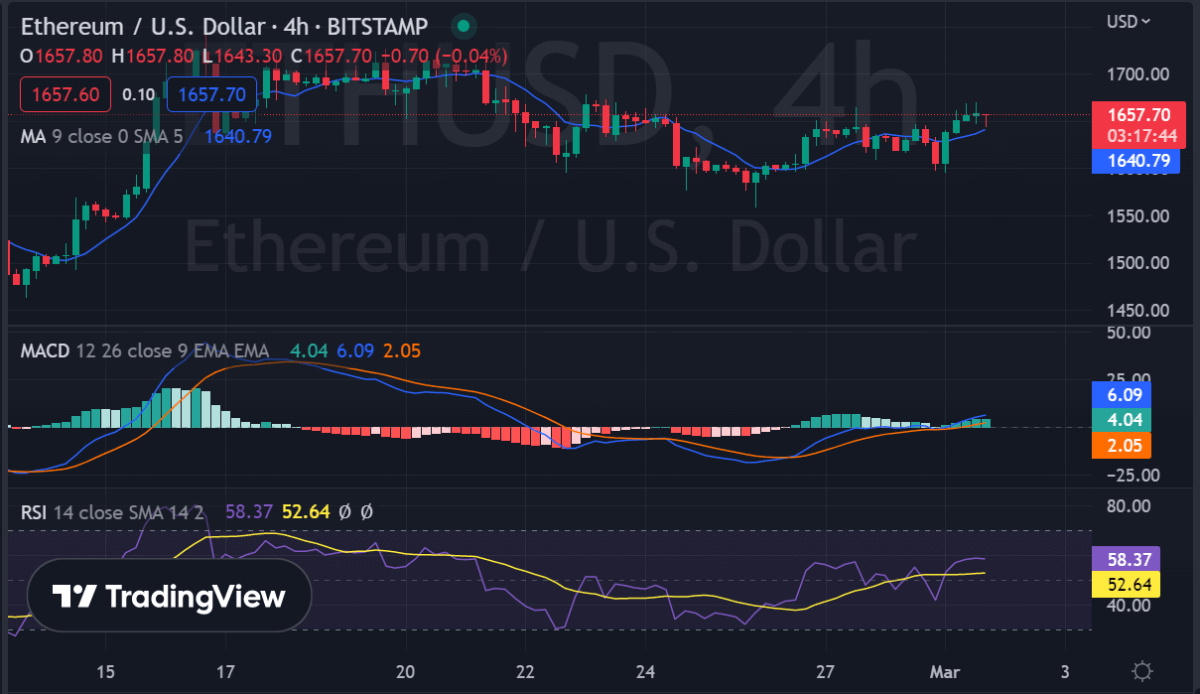
Ethereum price analysis for today indicates ETH is trading in a rangebound manner. Ethereum price is currently trading in a consolidation phase after a sharp rally from the lows of $1,400. The digital asset has been bouncing off between the key support and resistance levels of $1,620 and $1,650 respectively.

Ethereum price analysis shows Ethereum has traded at a low of $1,601.55 and a high of $1,662.51.ETH bulls need to break the key resistance of $1,650 in order to continue its current uptrend towards the next major hurdle at $1,750. If buyers manage to push above the $1,650 level, it could open the doors for ETH to continue its rally toward the psychological resistance of $2,000.
On the downside, if Ethereum fails to break above the current range where it is trading, then a correction toward $1,550 or below can be witnessed. In the case of such a scenario, the first support area for ETH to hold is $1,620. If buyers fail to defend this level, Ethereum could further slide toward $1,550 and then even lower towards $1,500.
ETH/USD 1-day price analysis: ETH unable to challenge the SMA200
Ethereum price analysis on the daily time frame shows the ETH/USD pair has formed a symmetrical triangle pattern. Ethereum price analysis indicates it is still unable to break above the SMA200 line, which could be seen as a sign of weakness. Ethereum seems to be in a consolidation process, as buyers and sellers are both looking for an opportunity to enter the market.

A break below $1,620 could push ETH/USD pair toward $1,550 which is represented by the Fibonacci retracement level of 50%. On the upside, a close above $1,650 is required to push Ethereum higher toward its next resistance at $1,750. In conclusion, ETH/USD pair needs to break the current range before any further move higher or lower can be seen.
On the daily chart, the technical indicator are painting a mixed picture. The MACD is trading below the zero line, which could indicate ETH bears have an edge in the market. However, the RSI is rising and currently trading close to 50 levels, which suggests that bulls could take control of Ethereum again soon.
Ethereum price analysis on a 4-hour chart: Bears trying to break the trend line
The 4-hour chart of the ETH/USD pair shows Ethereum has formed a descending triangle pattern. The digital asset is currently trading near the lower boundary of the triangle, where bears are trying to push prices below the $1,620 support level.

If buyers fail to defend this key support area, then Ethereum could slide further toward $1,550. On the other hand, if ETH/USD pair manages to break above the descending trend line and close above it, then Ethereum could start its journey toward $1,750.
The technical indicators are painting a bearish picture for ETH in the short term. The MACD is trading below 0 levels, which suggests bears are in control. Similarly, the RSI is also trading below 50 levels, which suggests that Ethereum could slide further to the downside if buyers fail to defend the current support levels.
Ethereum price analysis conclusion
The Ethereum price analysis for today shows ETH/USD pair is trying to break out of a consolidation phase and start its journey higher, but the digital asset is still unable to break through the key resistance levels. Ethereum needs to break above $1,650 in order for buyers to gain control again and push prices higher toward $1,750. On the downside, if Ethereum fails to defend the support of $1,620 then it could further slide toward $1,550 or below.


