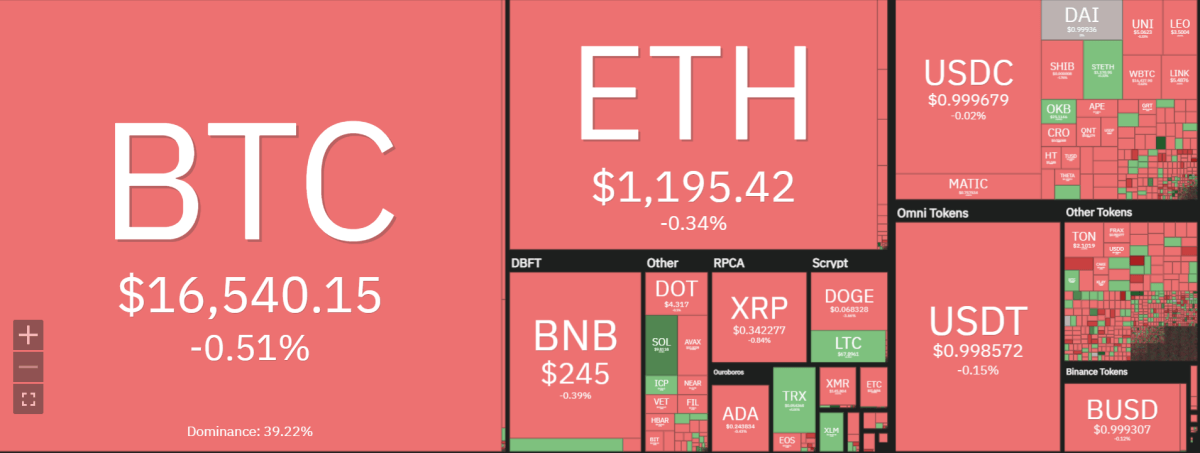
Ethereum price analysis for today reveals ETH is still trading below the $1,200 resistance level, which is a key hurdle for bulls to break. The price of ETH has failed to breach this level several times over the past few days and is currently doing so yet again. The $1,187.46 support is providing some comfort to buyers as Ethereum consolidates within a narrow range. Ethereum is trading at $1,196.16, down 0.10 percent after opening the day at $1,194.14.

After an intense decline to its annual low of $1.1K, our Ethereum price analysis reveals that 51 days have elapsed and the price has been stuck in a range between $1.1K – $ 1.3K. Chances are slim for any major change in the near future; instead, it is likely we will see further consolidation within the boundaries of this same range in the coming days ahead. The trading volume and the market cap have been decreasing over the past few days. The total market capitalization of Ethereum stands at $146.4 billion, and the 24-hour trading volume is currently at $4.08 billion.
A surprise move impacting Solana, a rivaling smart chain platform, has been greatly advantageous for Ethereum investors’ optimism. Even though the retracement has been steady in nature.
On Dec. 25, two prominent non-fungible token projects–eGods and y00ts–announced they were transitioning to Ethereum and Polygon chains with an opt-in migration. This switch will also bridge the DUST token—used in DeGods ecosystem for buying, selling, or minting NFTs—to both Ethereum and Polygon networks.
Even so, investors speculate that Ether could potentially drop to the $1,000 range since the U.S. Federal Reserve continues its course of increasing interest rates and depleting market liquidity.
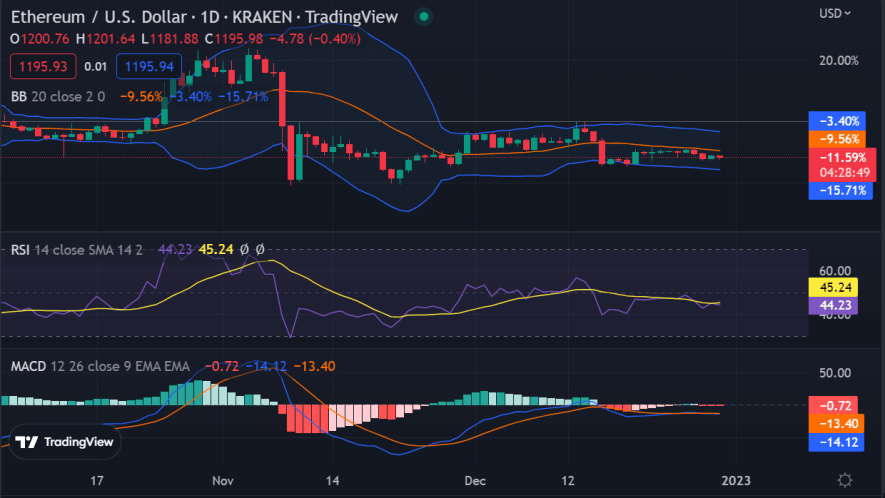
Ethereum price analysis on a daily chart: Bears and bulls remain in a perpetual tug of war
The daily chart for Ethereum price analysis shows that the bulls and bears are in a perpetual tug of war. Ethereum’s price is facing stiff resistance at the 50-day MA (moving average) and the 100-day MA.ETH price bulls continue to struggle as futures remain trading below its fair value, signaling excessive demand for shorts.
The Relative Strength Index (RSI) has been hovering in between the 40-50 zones, indicating that neither buyers nor sellers have had a sustained upper hand. As the ETH price continues to hover in and around the $1,190 mark, the bearish sentiment has become more evident.

The bears have been dominating the market for a few days now and any major upside move is being faded by them at every opportunity. It is likely that Ethereum will remain range-bound in the near term and until bulls re-emerge, the bearish pressure is likely to persist. The key resistance level to watch for Ethereum is the $1,200 mark. A breakout above this level could lead to a significant upside move in ETH price.
On the other hand, if the bears push the price below the $1,187 support area then we can expect ETH to test its yearly low of $1,052. The Fib extensions of the most recent Fibonacci Retracement levels indicate that Ethereum could drop to $890 if the bears succeed in breaking below the $1,052 level.
For now, it appears as though Ethereum is stuck in a holding pattern, with stagnant trading volumes, and no clear direction in sight. Until the bulls or bears gain a decisive advantage over the other, Ethereum will remain range-bound within its current levels.
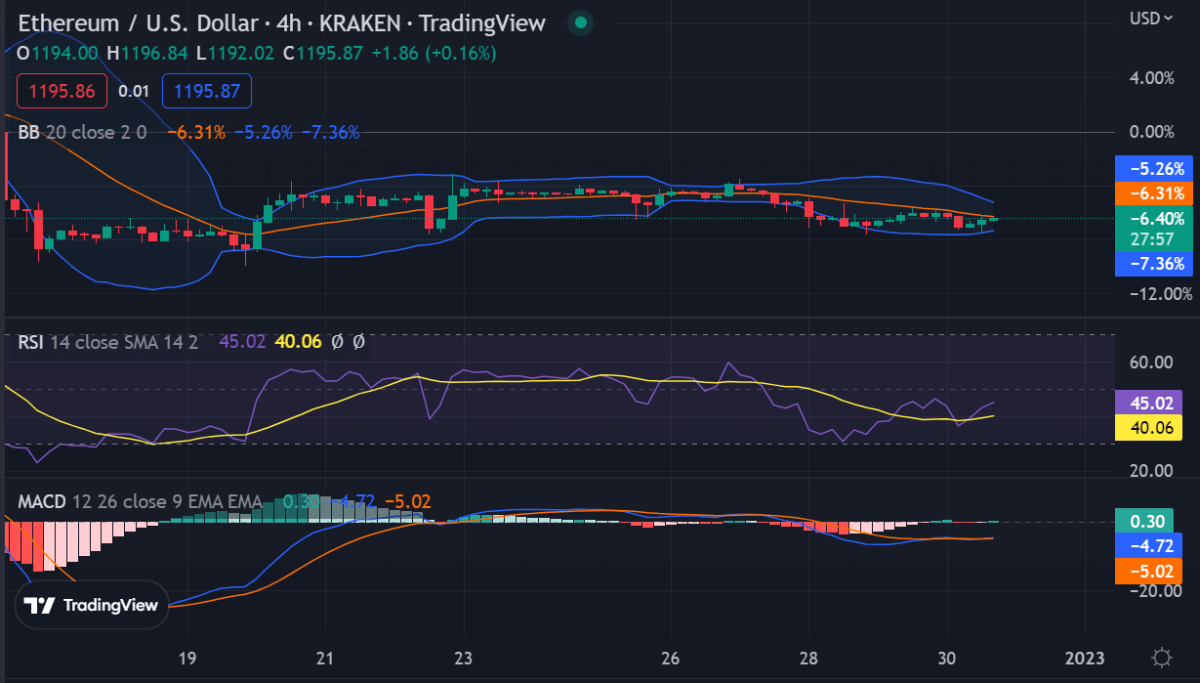
Ethereum price analysis on a 4-hour chart: Bulls defend the $1,190 level
The 4-hour chart for Ethereum price analysis shows that ETH is consolidating above the $1,190 support. Both buyers and sellers are unable to gain momentum on either side as the market is stuck in a tight range. Ethereum’s price has broken the bearish continuation correction flag pattern to the downside, and after a short pullback, it is now consolidating with low volatility. In fact, in the 4-hour timeframe, there are three static price levels of note – $1230 as resistance, and two support levels at $1160 and $1100 respectively.

Ethereum is currently in a constrained area between the $1230 resistance and the $1160 support, suggesting that its price may stay stagnant for some time. But be aware – if Ethereum’s price slides beneath the $1160 support level, we can anticipate another stage of consolidation between it and the record-low level of $1100.
The MACD and the RSI both show no distinct trend in either direction. The MACD is slightly higher than the zero line but is still restricted within the negative region, while the RSI remains motionless at 39. If the bulls manage to push Ethereum’s price above $1230, we can expect a surge in buying pressure and ETH could reach heights of up to $1340. On the other hand, if the bears succeed in pushing ETH below the $1100 support level then we can expect a major sell-off, and Ethereum could even drop to as low as $850.
Ethereum price analysis conclusion
Overall, Ethereum’s price action is showing signs of consolidation with no clear direction until there is some sort of decisive catalyst that will lead it to break below or above its current levels. Ethereum price analysis for today, however, shows that the overall sentiment remains bearish.
While waiting for Ethereum to move further, see our Price Predictions on XDC, Cardano, and Curve


