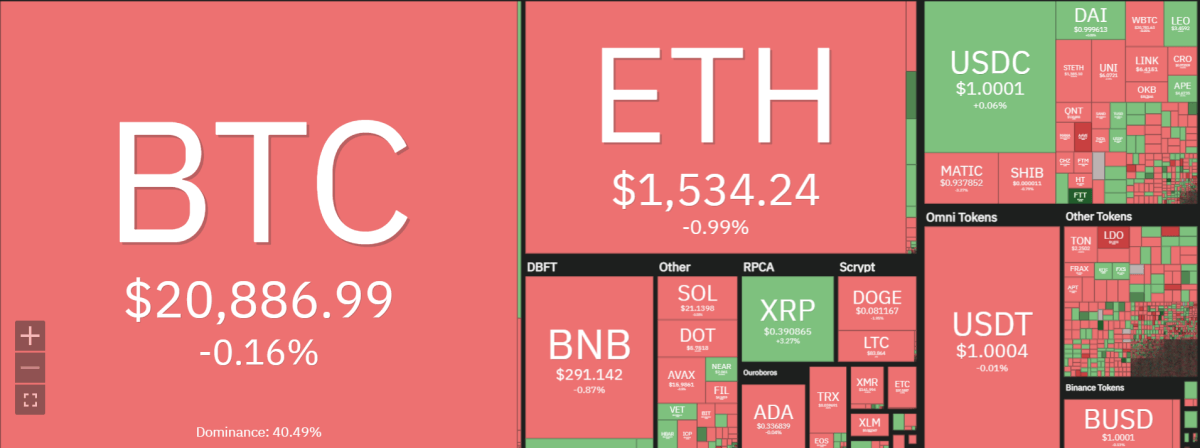
Today’s Ethereum price analysis indicates ETH has faced a minor pullback after failing to break above the $1,600 level. The ETH/USD pair traded as high as $1,594 before it faced selling pressure and began to decline. The price of Ethereum fell below the $1,550 support and tested the next key support at $1,500. ETH buyers managed to push the prices higher and the pair is currently trading around $1,537.60, down by 0.89 percent in the last 24 hours.

The hourly chart of ETH/USD shows that it has formed a bearish flag pattern below the $1,550 resistance. The bears are trying to push Ethereum’s price below the 50 simple moving average (SMA) and 100 SMA on the same chart. The trading volume has declined by over 25 percent from yesterday’s levels, which is a sign that the bullish momentum is fading.
The key support for Ethereum lies at $1,400, and if it breaks below this level, then ETH could fall to the next major support area at $1,200. On the other hand, if ETH buyers can protect the current support near $1,400 and push the price above $1,550, then a rally toward the $1,600 level could be possible.
Ethereum price analysis on a 1-day timeframe: Bullish outlook
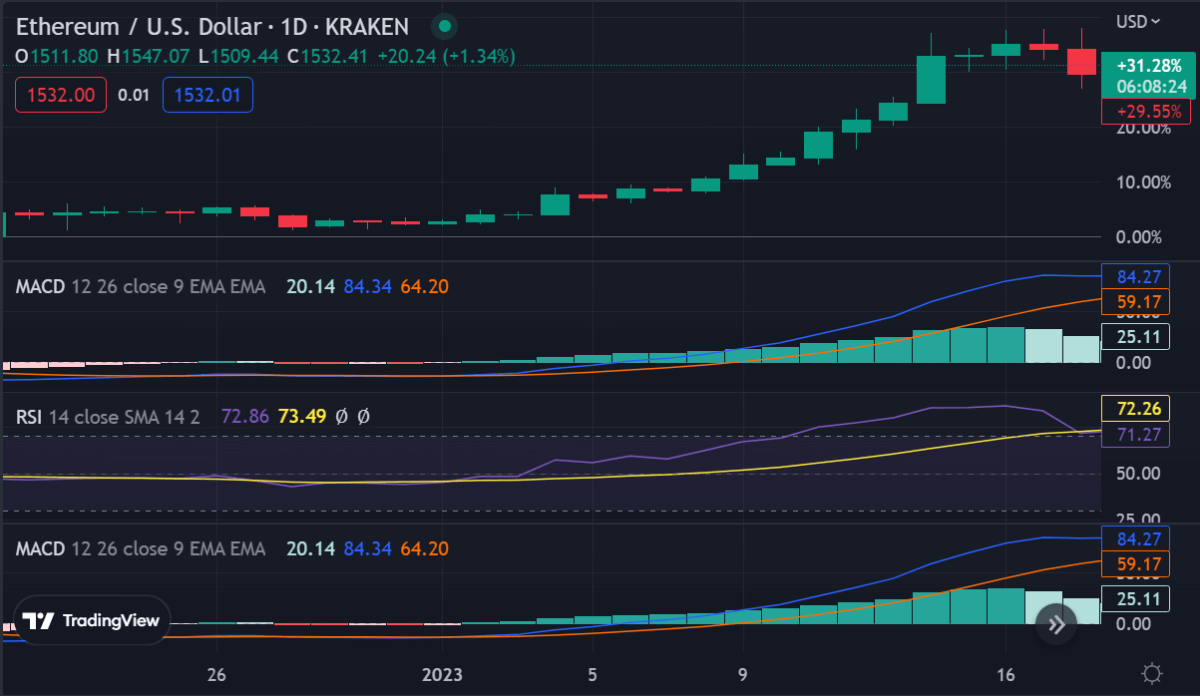
The 1-day chart of ETH/USD shows that the bulls are still in control and Ethereum is trading above the $1,400 support level. Ethereum price analysis shows ETH has been consolidating between the $1,400 and $1,600 levels for more than a month now. The MACD indicator is currently trending above the red signal line, indicating a strong bullish move is likely in the near term.

The Relative Strength Index (RSI) is still above the 70 level, suggesting that buying pressure is still present and Ethereum could soon break above the $1,600 resistance. If ETH buyers can push the price above this key resistance, then a rally toward the next major resistance area at $1,800 could be possible.
Ethereum is struggling to break through the $1,600 resistance level; this marks its third effort since September. Despite a 33% rally in 2021 thus far, Ethereum has yet to reach the highly sought-after landmark of attaining a market capitalization above $200 billion.
Ethereum’s layer-2 networks on Ethereum have seen a surge in daily active users and fees recently. This shows that the Ethereum DeFi sector is thriving despite the current market conditions and ETH price action.
Ethereum price analysis on a 4-hour chart: Bulls defend $1,400 support
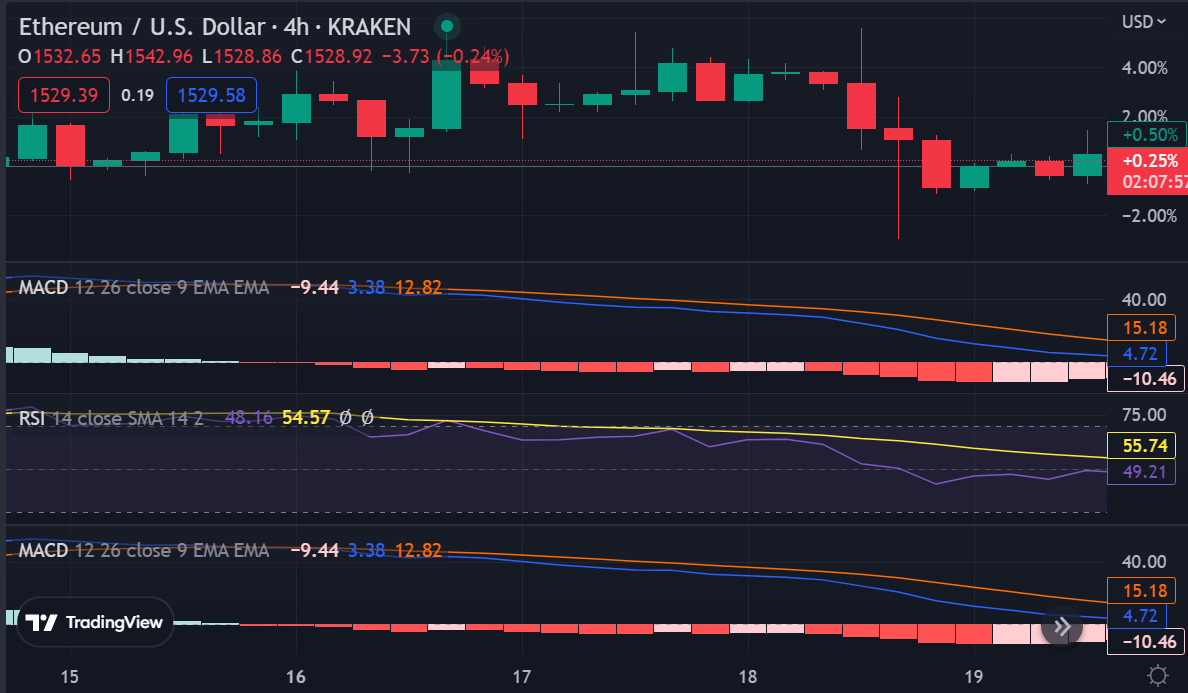
The 4-hour chart of ETH/USD shows that the bulls are defending the $1,400 support level. The price is currently trading above 50 SMA and 100 SMA. The RSI indicator is still in an uptrend and is above 70 levels, indicating a strong bullish momentum for Ethereum.
Ethereum price analysis on a 4-hour timeframe indicates ETH is trading in a range between $1,514.38 and $1,560.24. The bears have been adamant to break below the lower support, but this time they haven’t been successful while the $1,600 level remains the key resistance.

Ethereum price analysis shows that ETH is still in a bullish trend and it could soon break above the $1,600 level. However, if the bears manage to push the price below $1,400 then Ethereum could fall to its next major support at $1,200.
Ethereum price analysis conclusion
Ethereum price analysis on multiple time frames shows that ETH is consolidating between the $1,400 and $1,600 levels. The bulls have managed to defend the key support at $1,400 in recent days and are now trying to push the price above the $1,600 level.
The Ether’s resiliency, trading above $1,500 is promising news. However, this surge followed an 8% boost by the Russell 2000 index. Although investors attribute the cryptocurrency market revival to decreased inflation data, if stock markets slide back down it could trigger another selloff which would be detrimental to crypto prices. Because of this, speculators think Ether may fall back in value if the U.S. Federal Reserve continues to hike up interest rates.
While waiting for Ethereum to move further, see our articles on how to buy Polkadot, Filecoin, and Shiba Inu.


