The Ethereum price analysis shows a positive outlook for ETH, with the low of $1,430 being supported by bulls. The price has since spiked higher and is trading above the midline of the ascending channel. Strong buying pressure is expected to push ETH above its current levels, as it may break out of the channel to reach more significant resistance levels, such as $1,488.

At the time of writing, the ETH/USD pair is trading around the $1,472 mark and is likely to break out of the channel if the bulls remain in control. The 1.80 percent gain for the day is encouraging, and bullish sentiment remains strong.
The Ethereum market has been facing strong sell-offs in recent weeks and pushed the ETH/USD below the $1,500 mark. The current rally has been a welcome sign for investors and traders, who are hopeful that the digital asset will continue to increase in value.
Ethereum price movement in the last 24 hours: ETH/USD sets higher highs
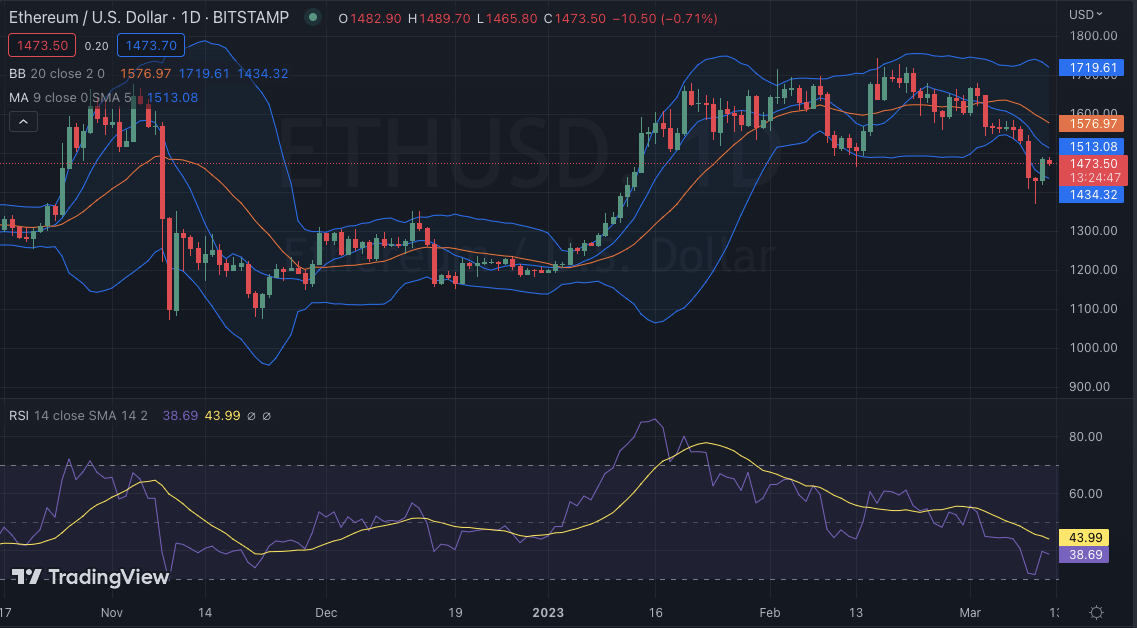
Ethereum price analysis today shows that ETH/USD has been on an upward trajectory, with the pair reaching higher highs. The ETH has been trading in a range between $1,430 and $1,488 as buyers have pushed the pair higher. The current resistance at $1,488 could be a crucial level to watch as if ETH breaks out of it, and then more buyers will likely enter the market. The support level was texted the previous day as the pair dropped to $1,430 but was quickly supported.
The market capitalization of Ethereum stands is up by 1.68% to $179 billion; however, the trading volume for the day is still low at $9.38 billion. Ethereum’s dominance over the market has increased slightly to 12.7%.

The moving average (MA) for the 1-day chart is at $1,513 as there has been bullish activity during the current week as well, but the SMA 20 is still trading below the SMA 50. At the same time, the Bollinger bands are widening, which could indicate increasing volatility in the market. The upper Bollinger band is currently at $1,719, while the lower band is at $1,434. The RSI is at 38.69 as the buying pressure has increased, and bulls are in control of the market.
ETH/USD 4-hour price chart: ETH shows a bullish tendency as the price rallies toward $1,472
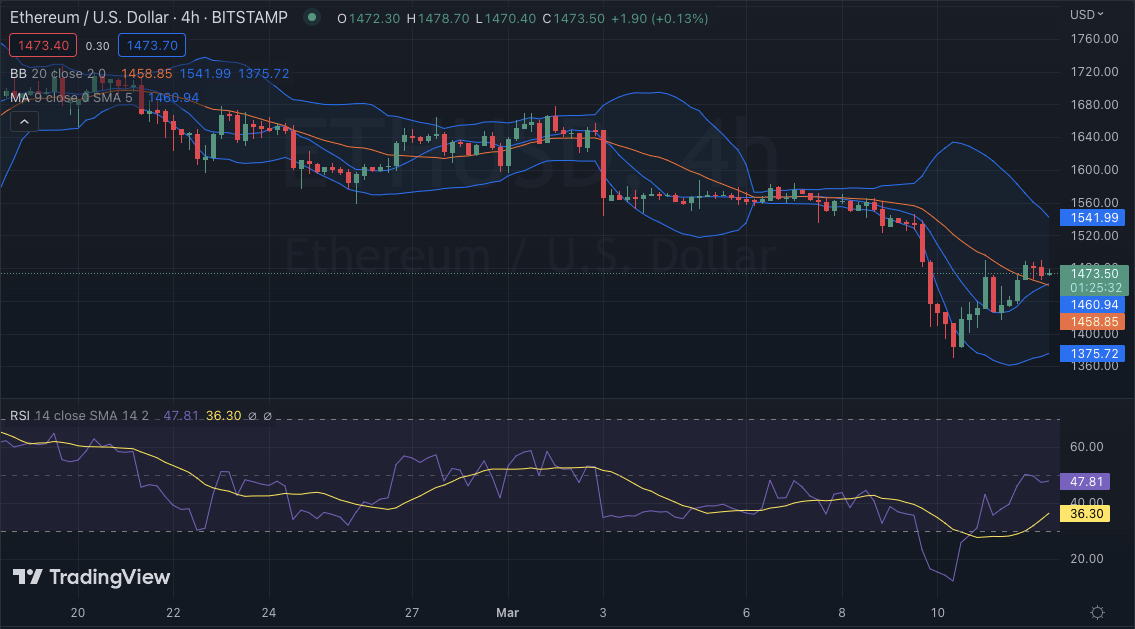
The price is rising again, as can be seen on the 4-hour Ethereum price analysis chart, as the bulls have regained their impetus in recent hours. The current ETH/USD exchange rate is $1,472, and it is anticipated that it may rise much more in the ensuing hours. The price is getting close to the first local resistance, around $1,488. Therefore, the price fluctuations have slowed down over the past few hours.

The moving average is at the $1,460 level for the 4-hour price chart as the bulls have gained the advantage of the situation as they have been able to reverse the continuous bearish trend in the past couple of days. The Bollinger bands indicator shows the following values; the upper value is $1,541, and the lower value is $1,375, hinting at the scope for price fluctuations. The RSI is slightly higher, at around 47.81, indicating that buyers are in control of the market.
Ethereum price analysis conclusion
To sum up, the Ethereum price analysis shows that the bulls have regained control in recent hours as they have managed to reverse the bearish trend, which saw ETH/USD trading below $1,400. The current value of $1,472 is expected to increase further as buyers are pushing it higher toward the resistance at $1,488. The upside pressure is strong, and so far, it has been able to combat the bearish trend. However, traders should remain vigilant as any change in market sentiment could lead to a decrease in the exchange rate.


