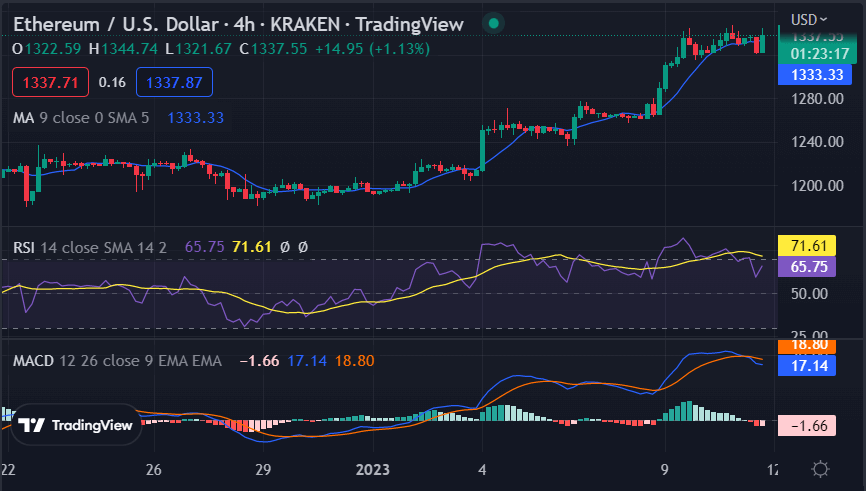
Ethereum price analysis for today shows ETH is at around $1,338.26, with a sideways trading sentiment. In the last 24 hours, Ethereum has gone up 0.44%.ETH is still trading below its yearly high of $1,453.96 which it set earlier in the month. The coin failed to keep above the psychological level of $1,400 and at present is holding on to the $1,300 level.
Despite the sluggish price action, Ethereum is still looking bullish on the 1D chart. Furthermore, its 50 and 200 Moving Average are still trending above its current market value. This indicates that ETH continues to have a strong support of $1,100 in case of a sell-off scenario. The trading volume for ETH has also been significantly higher than the average.
Ethereum price analysis on a daily chart: ETH likely to break out above $1,400
Ethereum price analysis for today shows that ETH is in a bullish bias with support at $1,100. The coin could break out above the psychological level of $1,400 if it continues to hold the current level. However, it is important to keep an eye on the trading volume and RSI indicators as they could be indicative of a potential trend reversal.
If the trading volume and RSI indicator remain healthy, Ethereum could soon break out above $1,400 in the coming days. Additionally, ETH is currently testing resistance at $1,350 and if it can sustain this level it could indicate further upside. On the downside, current support is present at $1,100 and any dip below this level could signal a bearish trend.

The SMA 200 is also trending above the current market value, which indicates that ETH could continue to remain bullish in the short term. The Exponential Moving Average (EMA) is also trending above its current price level and this could provide additional support. Ethereum price analysis shows that the coin is likely to continue to remain bullish in the short term, with a potential break out above $1,400.
Ethereum price analysis on a 4-hour chart: ETH is likely to consolidate
On the 4-hour chart, Ethereum price analysis shows that ETH is likely to hold its current level and possibly consolidate. The coin has been trading between $1,323.58-$1,342.76 over the past few days and this could indicate that it is on track for a breakout soon.

The technical indicators show the bulls are running out of steam, with the RSI currently at 71.61. However, the MACD is still in bullish territory and this could indicate a potential upside breakout. The Stochastic Relative Strength Index (RSI) is also trending above the 50 level, which indicates that ETH could be headed to consolidation soon.
Ethereum price analysis conclusion
In conclusion, Ethereum price analysis shows ETH is still trading in a bullish bias, with the coin holding on to the $1,300 support. The coin is likely to break out above $1,400 if it continues to hold the current level. On the downside, current support is present at $1,100 and any dip below this level could signal a bearish trend. Furthermore, the technical indicators suggest that ETH is likely to consolidate in the short term before potentially breaking out.
While waiting for Ethereum to move further, see our articles on how to buy Litecoin, Filecoin, and Polkadot.


