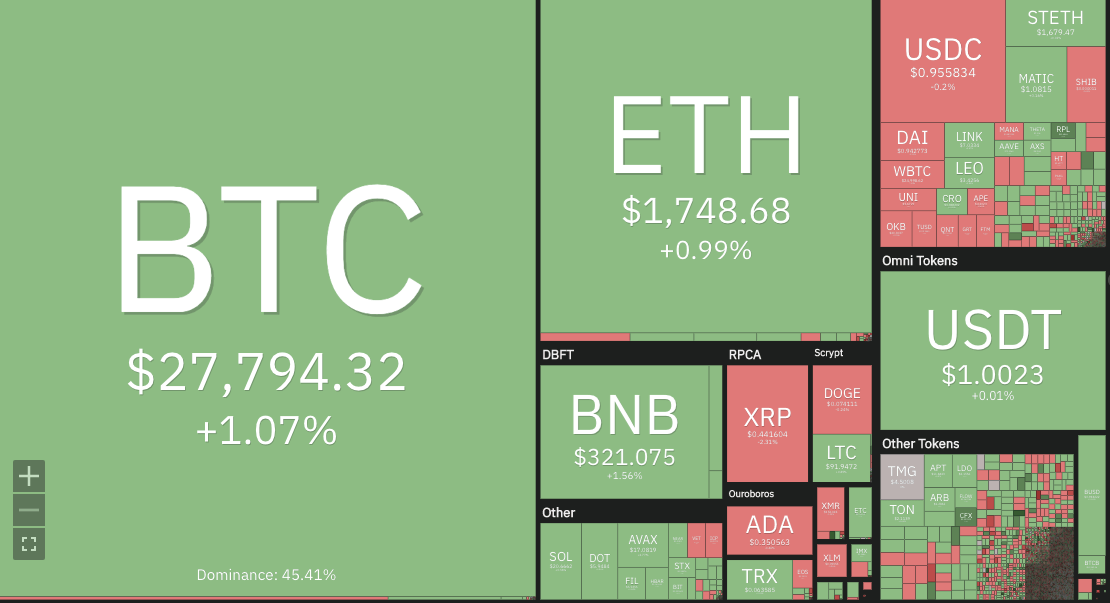
Ethereum price analysis shows a bullish trend emerging in the market. The digital asset is currently trading at $1,749 with 24-hour gains of 0.99 percent indicating that the buying pressure has been quite strong over the last 24 hours. The Bulls have been able to push the ETH/USD pair through all key resistances and the next target is set at $1,797 which if broken, could push Ethereum price analysis toward a high of $1,800.

The support level for ETH is seen at $1,716 where the buyers have stepped in during today’s trading session. If this support holds then we can expect more bullish moves ahead. And if bearish pressure builds up, then the lower support is likely to be tested at the $1,700 mark.
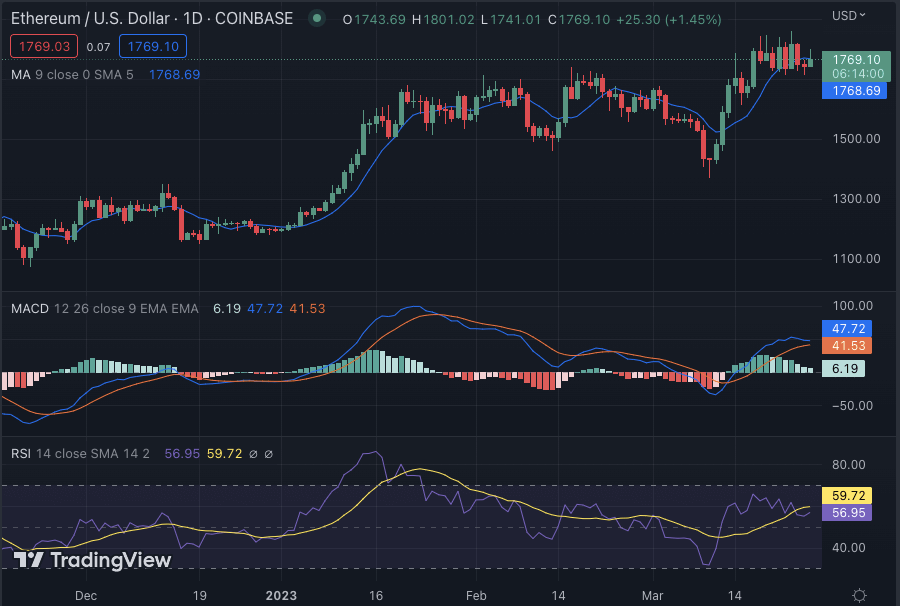
ETH/USD 1-day price chart: Tremendous increase in price as bulls regain momentum
The daily Ethereum price analysis is giving the bulls a lead as the price levels jumped to $1,748 after a strong bullish rally. This has been a major move for the bulls as it marks the highest point in the last 24 hours. The ETH has been trading in a range bound between the levels of $1,716 and $1,797 in the past 24 hours, and the move either above or below this channel could indicate the direction of the ETH price. The market cap of the ETH token stands at $216 billion and the 24-hour trading volume stands at $7.38 million, indicating that the market has plenty of liquidity with more buyers entering the market.
The coin has seen major support from the 50-day moving average, which has been pushing the price higher over the last few hours. The 200-day moving average is also providing strong support, which indicates that the buying pressure will remain strong in the market.

The Relative Strength Index (RSI) for ETH/USD is currently at 56.95 and indicates that the price momentum is still favoring an uptrend in the near term. The Moving Average Convergence Divergence (MACD) is also continuing to show a bullish trend. The MACD line (blue) has crossed above the signal line (orange), indicating more upside in the price.
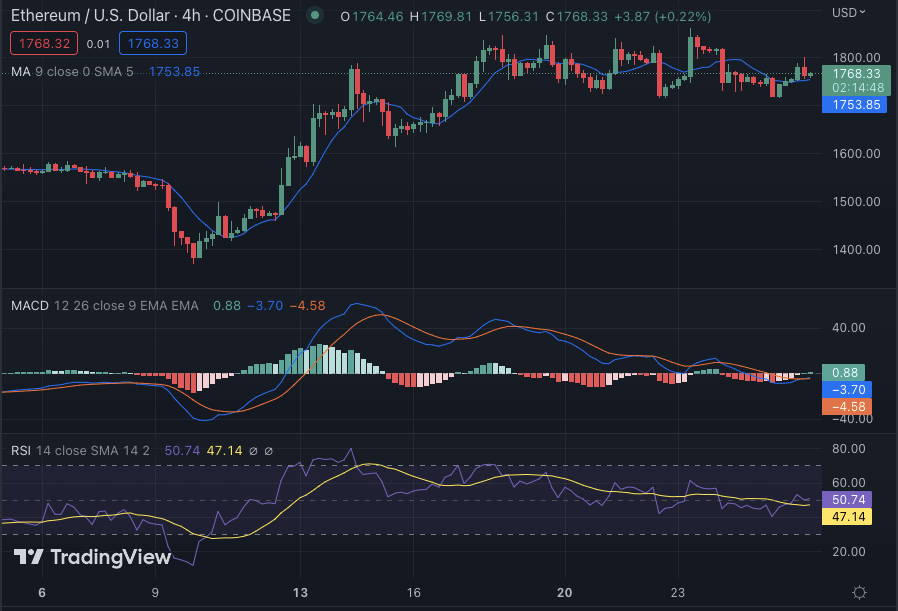
Ethereum price analysis on a 4-hour chart: ETH/USD trades above the $1,700 level
On the 4-hour chart, Ethereum price analysis, we can see that the market has formed an ascending parallel channel and is currently trading at the upper boundary of the channel. The market was in a bearish trend earlier today but the bulls managed to break out of the bearish trend line and have since been pushing the price higher.

Looking at the technical indicators, the MACD is in positive territory and shows a bullish crossover, indicating that the buying pressure is likely to continue in the near term. The RSI (relative strength index) is also in positive territory and above the 50 level which indicates strong bullish momentum. The moving average indicator is currently at $1,753 and continues to move up, which indicates further upside in the price of the ETH token.
Ethereum price analysis conclusion
Overall, Ethereum price analysis is showing a strong bullish sentiment in the market. The buying pressure is strong and the bulls need to maintain the momentum to push the price above $1,800. If they succeed in doing so, then this could open up more upside potential for ETH in the near future. The key support level that needs to be watched closely is $1,716 which if broken, could lead to a reversal of the uptrend. In addition, the technical indicators all point to a strong bullish sentiment, which could help push the price higher in the days ahead.
While waiting for Ethereum to move further, see our Price Predictions on XDC, Cardano, and Curve.


