Ethereum price analysis shows a bearish trend, with ETH sinking to lows of $1,581 as bears heighten their grip. The digital asset’s price has been on a downward slide for the past few days and this trend is expected to continue in the short term.

The past few hours had been exceedingly successful for the bears, as the downtrend is huge and cast negative results on the overall value of cryptocurrency. Yet, the most recent progress is going in favor of the bears, as observed from the price charts. The next support for ETH/USD price function is present at $1,569, where traders can hope for the price to bounce upwards if the support persists.
ETH/USD 1-day price chart: Ethereum is on the way to retesting the $1,580 support
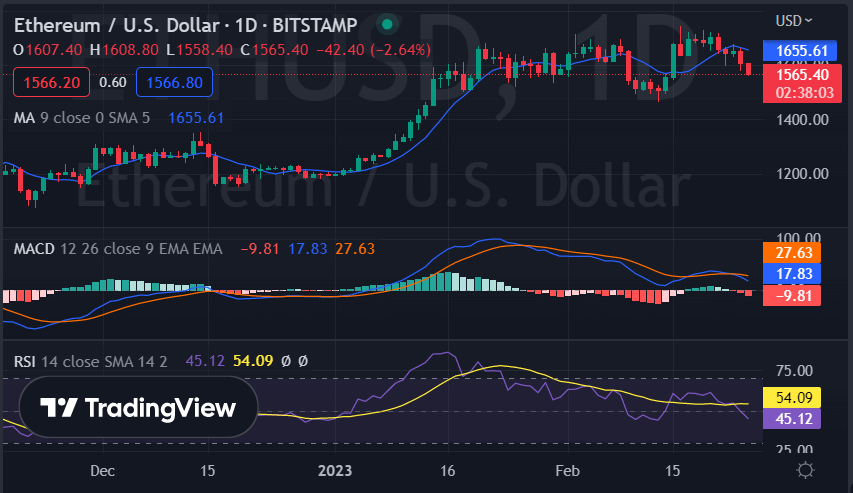
The 1-day Ethereum price analysis chart is detecting a sudden drop in the price today, as the price levels have almost reached $1,581. The past week has been unpredictable for the cryptocurrency, as there has been bearish control over the charts for most of the time. And today’s trend is going in favor of bears as well, and it is expected that the bearish momentum will intensify even further.

The 24-hour chart for Ethereum price analysis is indicating a bearish trend, as the MACD and signal lines have crossed below the 0-level. This crossover has resulted in the bears taking control over the ETH/USD pair. The RSI is also going downwards and currently standing at 45.12-level, which means that there are chances of further decline in prices. The moving average indicator is also indicating a bearish trend, as the 50-day EMA line is beneath the 200-day EMA.
Ethereum price analysis 4-hour chart: ETH is bearish below the $1,617 resistance
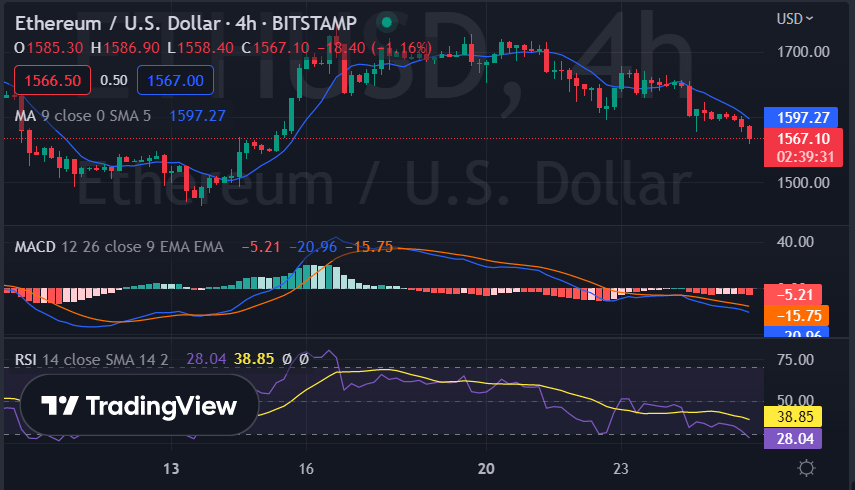
The Ethereum price analysis chart for the past four hours is detecting a bearish trend, with ETH/USD trading below the $1,617 resistance. The bullish need to break the resistance in order to turn things around, but that is looking increasingly unlikely. The bearish is still in control of the market, as the Market for ETH is forming low lows and low highs.

The Moving Average (MA) value is at $1,597 and has also been crossed by today’s price value after sinking below. The Relative Strength Index (RSI) score has also decreased up to index 28.04 today as the selling triggered. The moving average convergence divergence (MACD) indicator is also showing a bearish trend as the histogram is going downward.
Ethereum price analysis conclusion
The Ethereum price analysis shows a bearish trend, as ETH/USD pair continues to sink below the $1,600 level. The short-term support for ETH remains at $1,569, but that is also looking increasingly unlikely. The selling pressure is mounting and the bears have taken control of the market.


