Ethereum price analysis shows a bearish trend for today. The bears have taken over the price charts once again and have brought down the price from $1,224 to the $1,214 level; as the broader market is bearish, so is ETH. Selling pressure came in during the last hours of the previous trading session, which turned the entire trend bearish yesterday and is on the go till now. Though the price has been in the upper price channel as recently, however, ETH observed a new record high, but the coin is under a strong correction, and the loss is significant, further degradation of price is also expected in the hours.
The Cryptocurrency has lost its bullish momentum and is now down by more than 0.39%. In the recent few hours, ETH has been trading between $1,206 and $1,224; however, for any upside rally to happen, the coin has to break out of this price range.
ETH/USD 1-day price chart: Bulls stand helpless as bears dominate
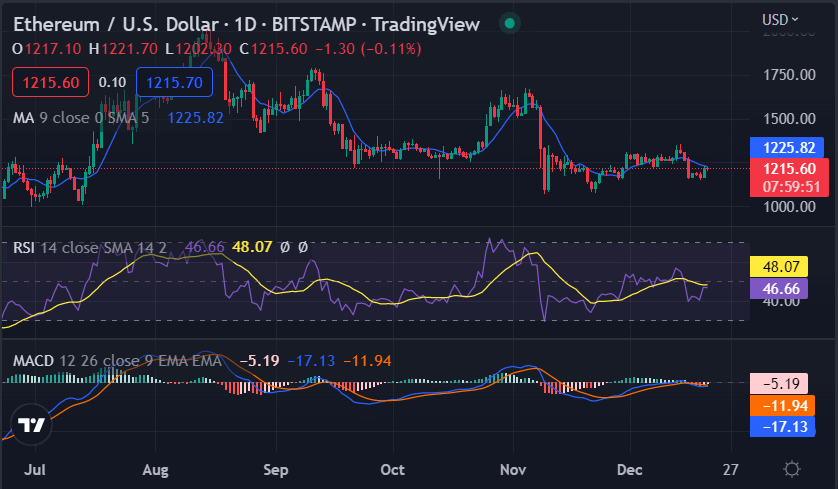
The 1-day price chart for Ethereum price analysis shows the price levels have sunk tremendously today as the price breakout was downwards today, and the price continues to go down. The ETHUSD pair is trading hands at 1,214 at the time of writing. As the coin is one downfall, the crypto pair is also showing a loss of 9.49 percent over the past week, as for the last seven days, bears ruled the market, and a bullish lead was observed for only one day. The trading volume has decreased by 33.115 percent over the last 24 hours, providing a market dominance of 11.68 percent.

The MACD indicator has crossed the signal line in the bearish area and is showing a strong bearish trend. The MACD line is at 0.0038, and the signal line is at 0.0191, observed a bearish crossover earlier today. The RSI indicator is also at 48.07, now heading downwards, showing an oversold market. The moving average is currently at 1,225 just above the current price level.
Ethereum price analysis: Recent updates
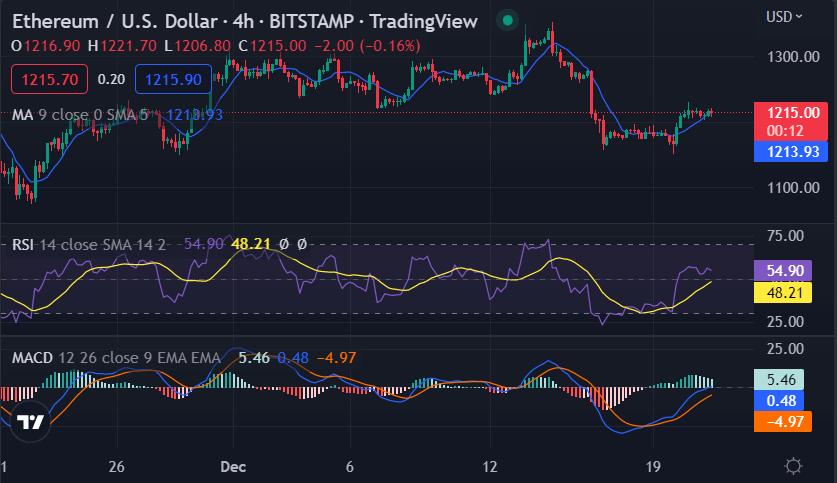
The 4-hour price chart for Ethereum price analysis shows a continuous degradation of price, and no considerable bullish effort has been observed today, even though bulls intervened in between and tried to elevate the price levels for a few hours, but they were soon outplayed by bears. The price is going down again and has been seen decreasing in the last four hours as well.

The MACD indicator on the 4-hour chart is also showing a bearish crossover as the histogram narrows down and the signal line is below the MACD line. The relative strength index (RSI) has entered the undersold zone recently, and its curve is downwards as of now as it is showing a score of 48.21. The RSI curve indicates the high selling activity in the market and the great bearish pressure that has engulfed the price action. The moving average indicator is also showing bearish signals, and a death cross is likely to be formed in the near future.
Ethereum price analysis conclusion
Overall, Ethereum price analysis has been trading in a bearish trend in the past week, and today’s price action is also following the downward move. The market is likely to remain bearish in the near term, and if the bulls try to intervene and take control of the market, we can expect a bullish momentum for some time.


