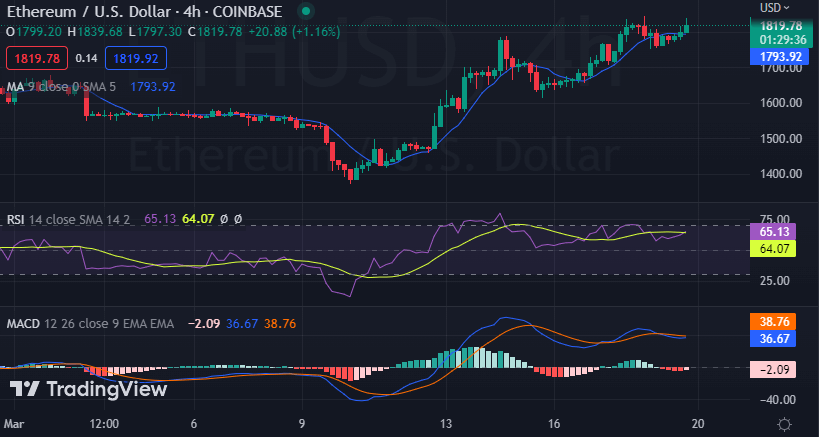
The Ethereum price analysis is bullish today as the coin continued upside above $1,800. ETH prices hit a new all-time high of $ 1,815 today, and the outlook is quite positive for buyers. The positive sentiments come after a strong surge in the last couple of days. For now, Ethereum’s price is trading at $1,814. It is currently up by 1.77% in the last 24 hours and 7.08% every week.
The market capitalization has surged to $223 billion, with an increase of 1.77% on the day. However, trading volume is slightly down to $8 billion. The circulating supply stands at 122,373,866 ETH.
Ethereum price analysis 1-day price chart: ETH price reaches $1,815
Looking at the 1-day price chart of Ethereum price analysis, it is evident that the coin has broken above the crucial level at $1,800, which is a massive bullish sign. The price is now trading at a high of $1,815, but there is stiff resistance in front of it which is likely to restrict further upside.
The immediate resistance for ETH/USD is present at $1,835, and if that level breaks, then the next target can be the psychological mark of $1,850. On the downside, support for cryptocurrency is present at $1,756, and if that level breaks, then Ethereum’s price could drop to $1,700, which can be a good opportunity for buyers to enter the market again.

The moving average indicator is currently at $1,685, which is an indication of strong bullish sentiment in the market. The Relative Strength Index indicator is currently at 65.89, which is a sign that the Ethereum price could still see some upside as buyers remain in control. The moving average converges divergence also looks positive, which is a sign of increasing buying pressure in the market.
Ethereum price analysis: Green candlestick is still present
The hourly chart of Ethereum price analysis shows that the green candlestick is still present, which is a sign of bullish momentum in the market. The market opened at $1,796, and the Ethereum price rose to a high of $1,815. However, some minor bearish pullback was seen near the $1,800 mark. Currently, the coin is trading above the $1,800 level with a good amount of positive momentum.

The Relative Strength Index (RSI) is yet again confirming the uptrend as it has moved up to an index of 65.13 today. The moving average convergence divergence (MACD) is also showing positive sentiment as the MACD line has moved above the signal line. The histogram is still green, and it looks like buyers are going to remain in control of the market for some time. The 50-day and 200-day simple moving average is also trending upwards, which is a sign of strong bullish sentiment in the market.
Ethereum price analysis conclusion
Overall, the Ethereum price analysis is bullish today as buyers are driving the market higher. The coin has broken past the crucial level at $1,800, and it looks poised to continue its uptrend in the next few days. Ethereum could see further upside if buyers manage to break above the $1,835 resistance level.
While waiting for Ethereum to move further, see our Price Predictions on XDC, Cardano, and Curve.


