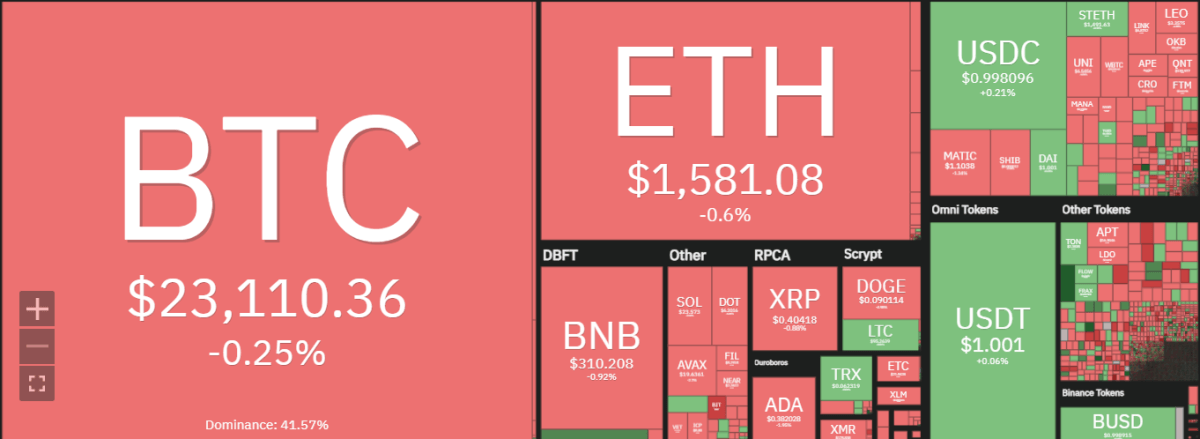
Ethereum price analysis shows a downtrend that has been in effect since the beginning of today. The ETH/USD pair has decreased by more than 1.22% over the past 24 hours, crashing down to as low as $1,573. The market for ETH/USD has been unable to find a stable support level, and the current intraday low is $1,569.

Ethereum Crypto has been one of the better-performing assets over the past week as the bulls have managed to push the price up above $1,600. However, the bulls were unable to break through this level of resistance and the bears took control. The cryptocurrency has a market capitalization of $192 billion and is the second-largest cryptocurrency by market capitalization, while the 24-trading volume of Ethereum is $5.840 billion.
ETH/USD 1-day price chart: Bearish swing deflates price levels to $1,573
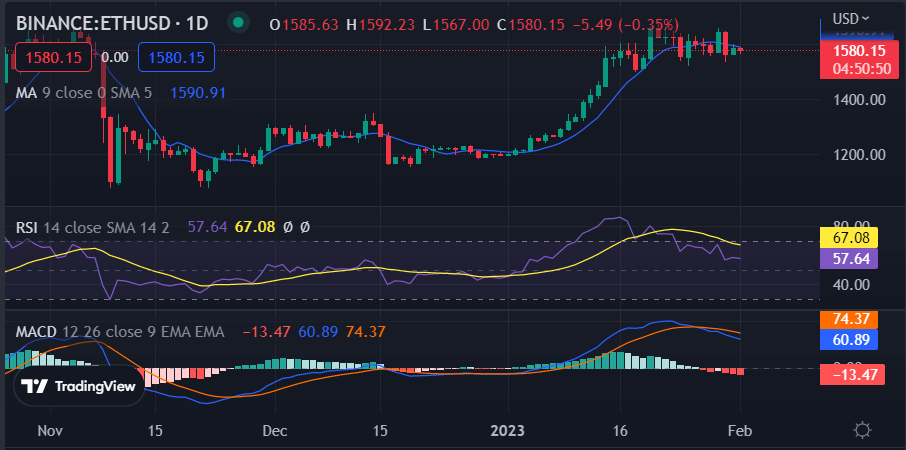
The 24-hour Ethereum price analysis shows that the bears have been in control for the past few trading sessions, and the ETH/USD pair has dropped from a high of $1,610 to a low of $1,569. The pair is currently trading at $1,573 and the buyers will have to break through the resistance of $1,597 in order to turn the market bullish. The previous day has been quite discouraging for the cryptocurrency as a strong bearish trend was going on. Similar trends have been reported during the last 24 hours as well.

The 50-day moving average (MA) has crossed below the 100-day MA, indicating that a bearish trend may be forming. The RSI for Ethereum Crypto is currently on a downward spiral and seems headed toward the oversold territory rapidly. It is currently transacting at 67.08 and continues to make strides whereas the red histograms for the MACD line are heading downward indicating a bearish trend.
Ethereum price analysis: Bearish depression results in a collapse below $1,600
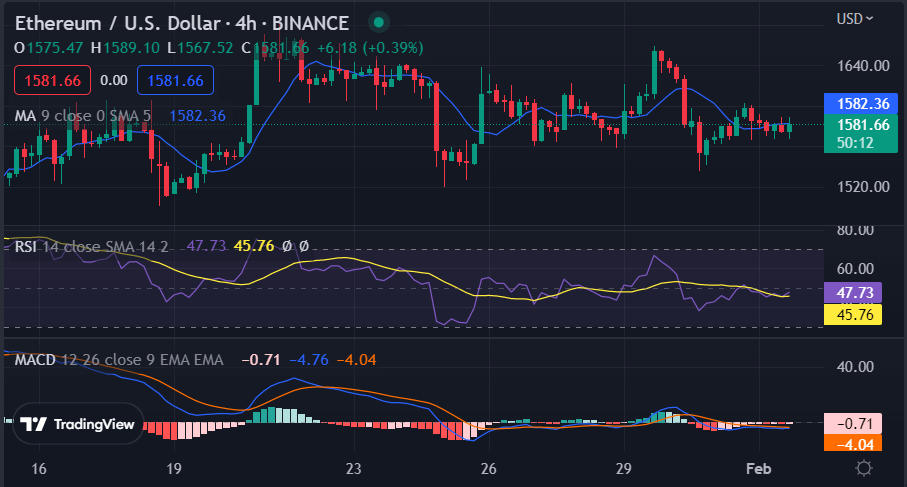
The 4-hour Ethereum price analysis is showing signs of bearish momentum as the price decreased quite significantly. The price has been declining consistently as the cryptocurrency is showing a downward tendency. A reduction in price has been recorded in the last four hours as well as the price levels moved down to $1,573. Moving on, the moving average indicator shows its value at $1,582 at the time of writing.

The 50-day moving average is currently trading below the 100-day MA, while the RSI is also reporting a bearish sentiment. The MACD indicator is showing a bearish crossover with the MACD line and signal line heading downwards. These combined factors indicate that the bearish trend is likely to continue in the near future and ETH/USD could move down further, potentially hitting $1,500 in the coming days. The RSI is already in the oversold territory and the bears seem to have taken control of the market.
Ethereum price analysis conclusion
Ethereum price analysis shows that a downtrend has been following for the past few hours. The bears are leading the game at the moment, and the price levels have been brought down to $1,573 as a consequence. A further downfall can be expected as the bears have been dominating for the past few hours as well. The price has been persistently moving down, which means that chances of improvement for the bulls are still on the limited side.


