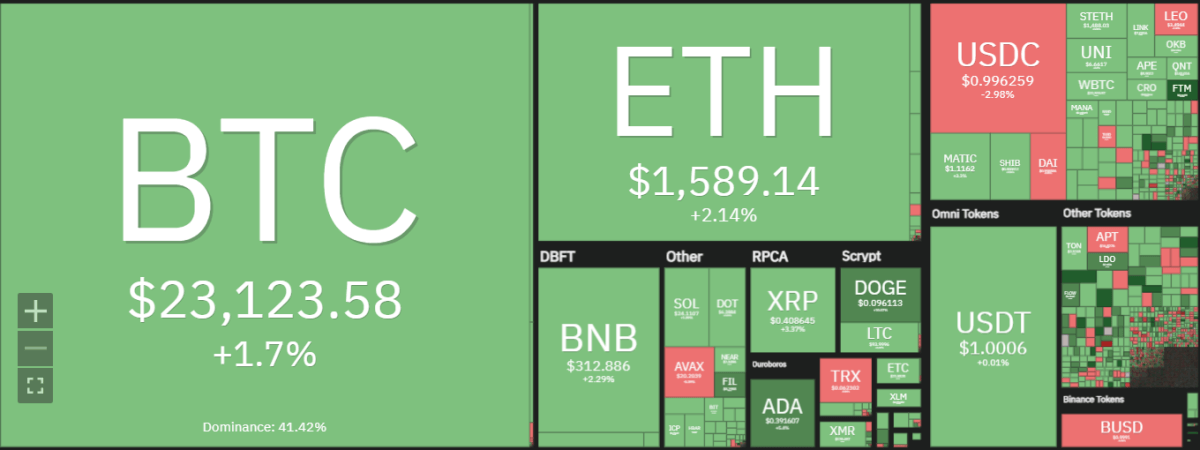
Today’s Ethereum price analysis reveals the cryptocurrency price is moving in a bullish manner as an upward trend has been following, and the price has undergone a notable improvement in the last 24 hours. The bullish upswing has resulted in an impressive enhancement in the price as its value has upgraded to $1,546, as the price has been following a bullish trend since yesterday. Although the price experienced bearish toppling at certain points, now the price might move on to even higher levels in the approaching hours as well.

The ETH/USD pair is currently trading in a range between $1,546 and $1,598. The resistance for ETH is currently present at the $1,598 level, whereas strong support has been raised to the $1,546 level. The market cap for ETH is $193 billion, whereas the 24-hour trading volume is $6.371 billion which shows there is a notable interest in the ETH/USD pair among traders.
Ethereum price analysis 1-day price chart: ETH gains significantly in the last 24 hours
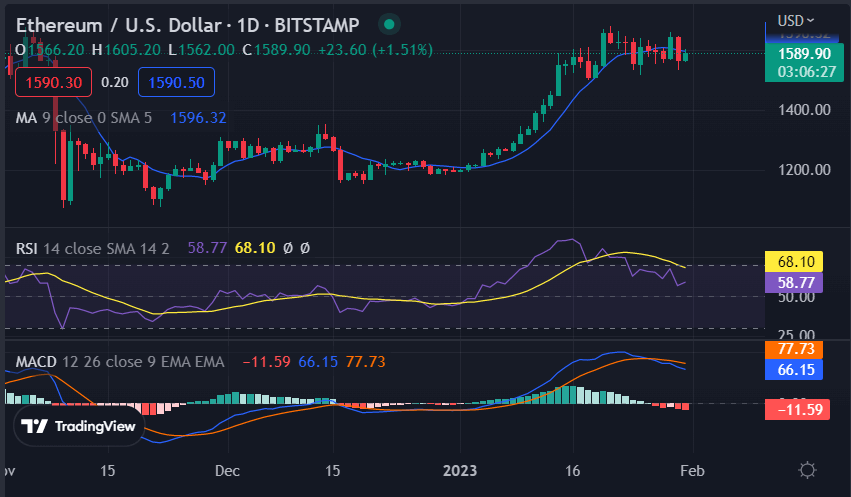
The Ethereum price analysis 1-day chart reveals that ETH’s price has undertaken a considerable increase over the past 24 hours, as after 2 days of interrupted bearish plunging, the price got a grip and retrieved back to $1,593. The bulls were able to push the market upwards in the face of opposition from the bears, and so far the performance has been quite impressive.

The current market bullishness might lead to further increments in the price if it can sustain its upswing. The technical indicators are suggesting a strong buy signal for ETH/USD at the moment as both MACD and RSI values are above 50. According to the moving indicator, the pair is likely to find strong support at around $1,585, which is an optimistic sign for bulls.
Ethereum price analysis: Recent developments and further technical indications
The 4-hour price chart for Ethereum price analysis shows the price breakout was downwards at the end of yesterday’s trading session, as the coin was in correction for the past hours, and there on, bulls took the lead back and enhanced the price to $1,593as they started the upwards march again. Bulls have recovered the price to a level where the bullish trend has been reinstated. Currently, the ETH/USD has gained 2.39% in the past 24 hours and is likely to increase further in the upcoming sessions with more bullishness.

The technical indicators are also suggesting bulls have an upper hand over bears at the moment as moving average convergence divergence (MACD) and relative strength index (RSI) are on the positive side. The MACD line has shifted above the signal line, and RSI values have risen to 50.01 which is a sign of strong buying pressure in the market. The upcoming sessions might bring further increments or price corrections as ETH/USD finds resistance at the $1,598 level. The 50-day and 200-day moving averages are in a sideways trend, which further confirms that the current bullishness is likely to continue.
Ethereum price analysis conclusion
To sum up, At the moment Ethereum price analysis shows more upswings and bullish trends can be expected in the coming sessions, as the technical data suggests bulls might overpower bears soon. However, there are chances of price corrections or bearish trends if buyers fail to sustain their upswing.
While waiting for Ethereum to move further, see our Price Predictions on XDC, Cardano, and Curve


