The recent Fantom price analysis confirms a bullish trend for the cryptocurrency, intensifying the buying momentum. A green candlestick is marking the price chart, indicating a rise in the coin value. If the bullish rally continues in the future, further improvement in FTM/USD value can be expected. The recent upturn has taken the price to $0.230 as it is recovering. However, the coin seems to be range bound since 19 September 2022 after the strong correction, which was observed on 18 September 2022. The price has leveled up to yesterday’s opening level, and if bulls gain more strength, then a break above can be expected.
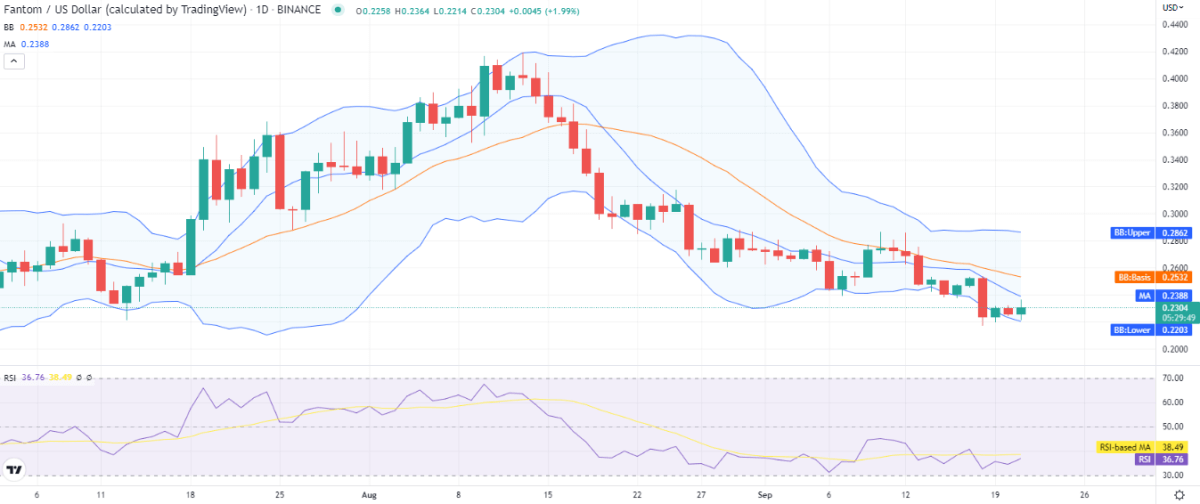
FTM/USD 1-day price chart: FTM bulls recover 3.82 persent value
The one-day Fantom price analysis shows that the bullish momentum has recovered in the past 24 hours. Although the cryptocurrency faced loss in the past few days, the bulls are now on their way toward achieving their next target of breaking above the current price level. The short-term trending line is still traveling descendingly, and the price is now settling at the $0.230 mark after the latest upturn. The cryptocurrency is reporting a 3.82 percent increase in value for the last 24 hours, but at the same time, the coin has been at a loss of 4.45 percent for the past week. The price is still below its moving average (MA) value, i.e., $0.238.

The SMA 50 curve is still traveling at a greater height than the SMA 20 curve, as the bears have been overpowering the market trends since 11 August 2022. If we move towards the Bollinger bands indicator, then it shows increasing volatility with its upper band at $0.286, which represents resistance, and the lower value is $0.220, which represents the strongest support. The Relative Strength Index (RSI) score has improved to an index of 36 after the bullish return, hinting at the buying momentum in the market.
Fantom price analysis: Recent developments and further technical indications
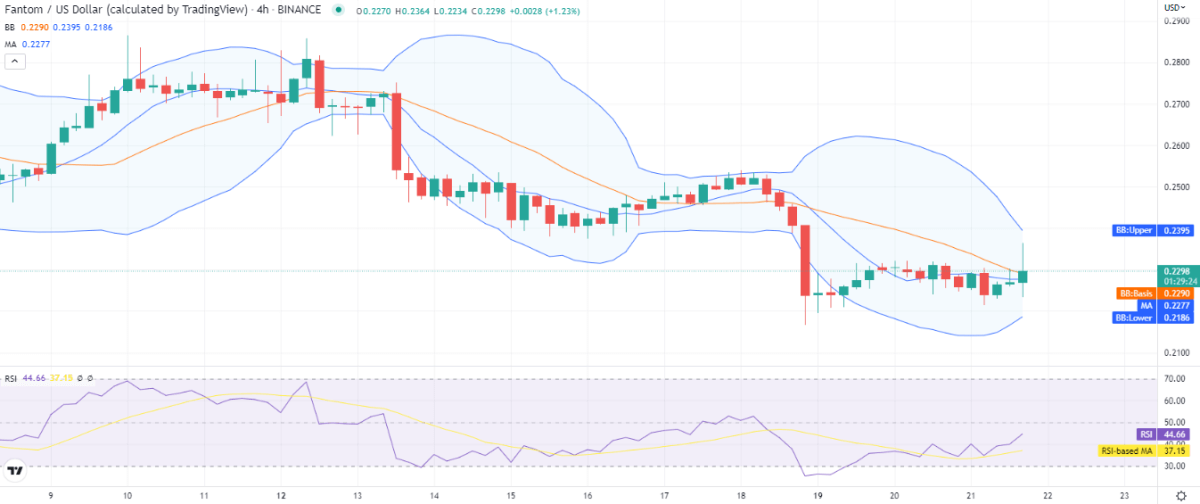
The hourly Fantom price analysis is going in a bullish direction as the price underwent a sufficient increase in the past few hours. The market trends fluctuated late at night when bears intervened and brought a strong correction, but currently, the bulls are moving ahead. Due to the latest bullish current, the price moved up to $0.229 in the last four hours. A further increase is highly possible if the bulls remain consistent. The moving average value is also present at the $0.227 mark.

The volatility is decreasing, which is because of the price oscillating in the same range for the third day consecutively, but the Bollinger bands may start to diverge if bulls gain more strength. The upper band of the Bollinger bands indicator is now touching the $0.229 position, whereas its lower band is at the $0.218 position. The RSI score is in a quiet neutral zone and has increased up to index 44 due to the latest upturn taken by the price curve.
The cryptocurrency faced a considerable loss in the preceding weeks, which was further confirmed by the technical indicators available for analysis. There is a selling signal for FTM/USD because of the constant bearish shadow over the market despite the fact that the rice has increased today. There are 14 indicators on the selling side; eight indicators are neutral, whereas only four are on the buying side out of a total of 26 technical indicators.
Fantom price analysis conclusion
The one-day and four-hour Fantom price analysis shows quite encouraging results for the buyers today, as the price followed an upward curve. The coin value has been raised to $0.230 due to the latest bullish wave. At the same time, the four-hour price chart displays green candlesticks as the market followed a bullish trend in the past few hours.
Disclaimer. The information provided is not trading advice. Cryptopolitan.com holds no liability for any investments made based on the information provided on this page. We strongly recommend independent research and/or consultation with a qualified professional before making any investment decisions.


