Filecoin price analysis reveals a bearish trend in the market and that it is stuck in a consolidation phase around the $6.25 level. The intraday bias remains bearish as long as the price is trading below the $6.94 resistance level. A break above this resistance level could lead to a bullish breakout. On the downside, a break below the $6.07 support could trigger further selling pressure and push the Filecoin price down to its next key support areas at around $6.05 and $6.07, respectively. The technical indicators on the daily chart are all pointing toward bearish momentum, which is why traders should look for short-term selling opportunities. However, investors should take a wait-and-see approach before jumping into the market, as further price action is needed to confirm the trend.
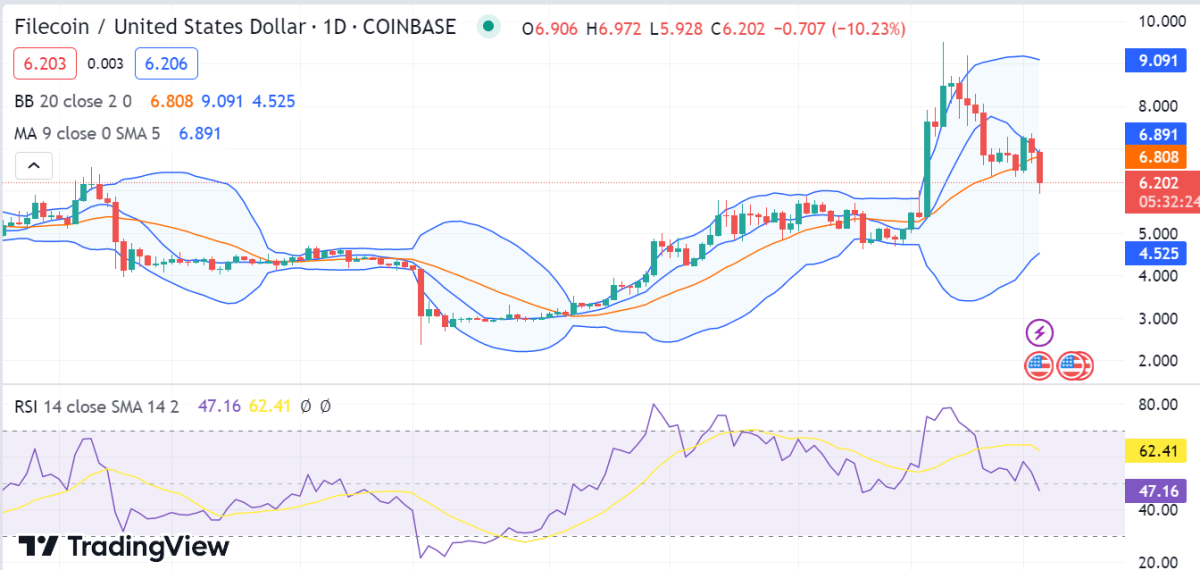
Filecoin price analysis 1-day price chart
The 1-day Filecoin price analysis shows that the price function is headed down once again as the price levels are continuously sinking. The bears have been able to keep the price in check and push it lower since the start of today. The current level is near $6.07, which is a key support area, and if breached could lead to further sell-off with potential targets at around $6.20 and $6.23, respectively.

The moving average (MA) shows a bearish crossover, indicating a downtrend. The RSI is also showing bearish momentum, having fallen below 70 in the past few days with no signs of a reversal yet. The volatility, on the other hand, is high, which is also a negative indication for the future of Filecoin in the current scenario. The upper and lower values of the Bollinger bands represent the strongest resistance and support for the coin as they are settled at the following points; the upper value is at $9.091, while the lower value is at $4.525
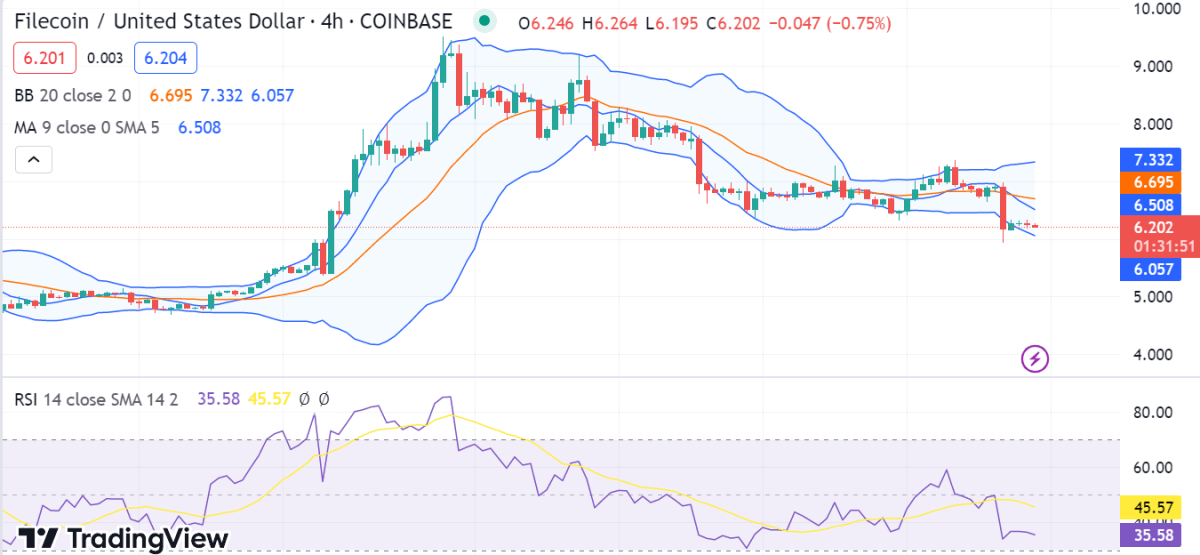
FIL/USD 4-hour price chart: Bearish spell causes FIL to drop to $6.26
The 4-hour Filecoin price analysis is trading at a level of $6.25 and has been stuck in consolidation for a few days now. The market volatility is high, as there has been a significant fluctuation in price as bears and bulls battle for price control. The lower band of the Bollinger Bands is well below the current market price, which shows that prices are likely to head lower in the near future.

The moving average (MA) is also above the current price, which is $6.508. Both the 50-day and 200-day MA are trending below the current price level, pointing to further sell-offs in the near term. The Relative Strength Index index is present at the neutral point of 45.57 and is not indicating any strong inclination towards buying or selling.
Filecoin price analysis
In conclusion, the short-term trend for Filecoin appears bearish, and traders should look for selling opportunities. However, investors might want to wait for further price action before entering the market, as the current volatility is high and there could be potential reversals in the near future. Overall, bears have the upper hand, but bulls could gain control if prices break above the $6.94 resistance level and remain there for some time. Until then, traders should keep a close eye on Filecoin price movements and act accordingly.


