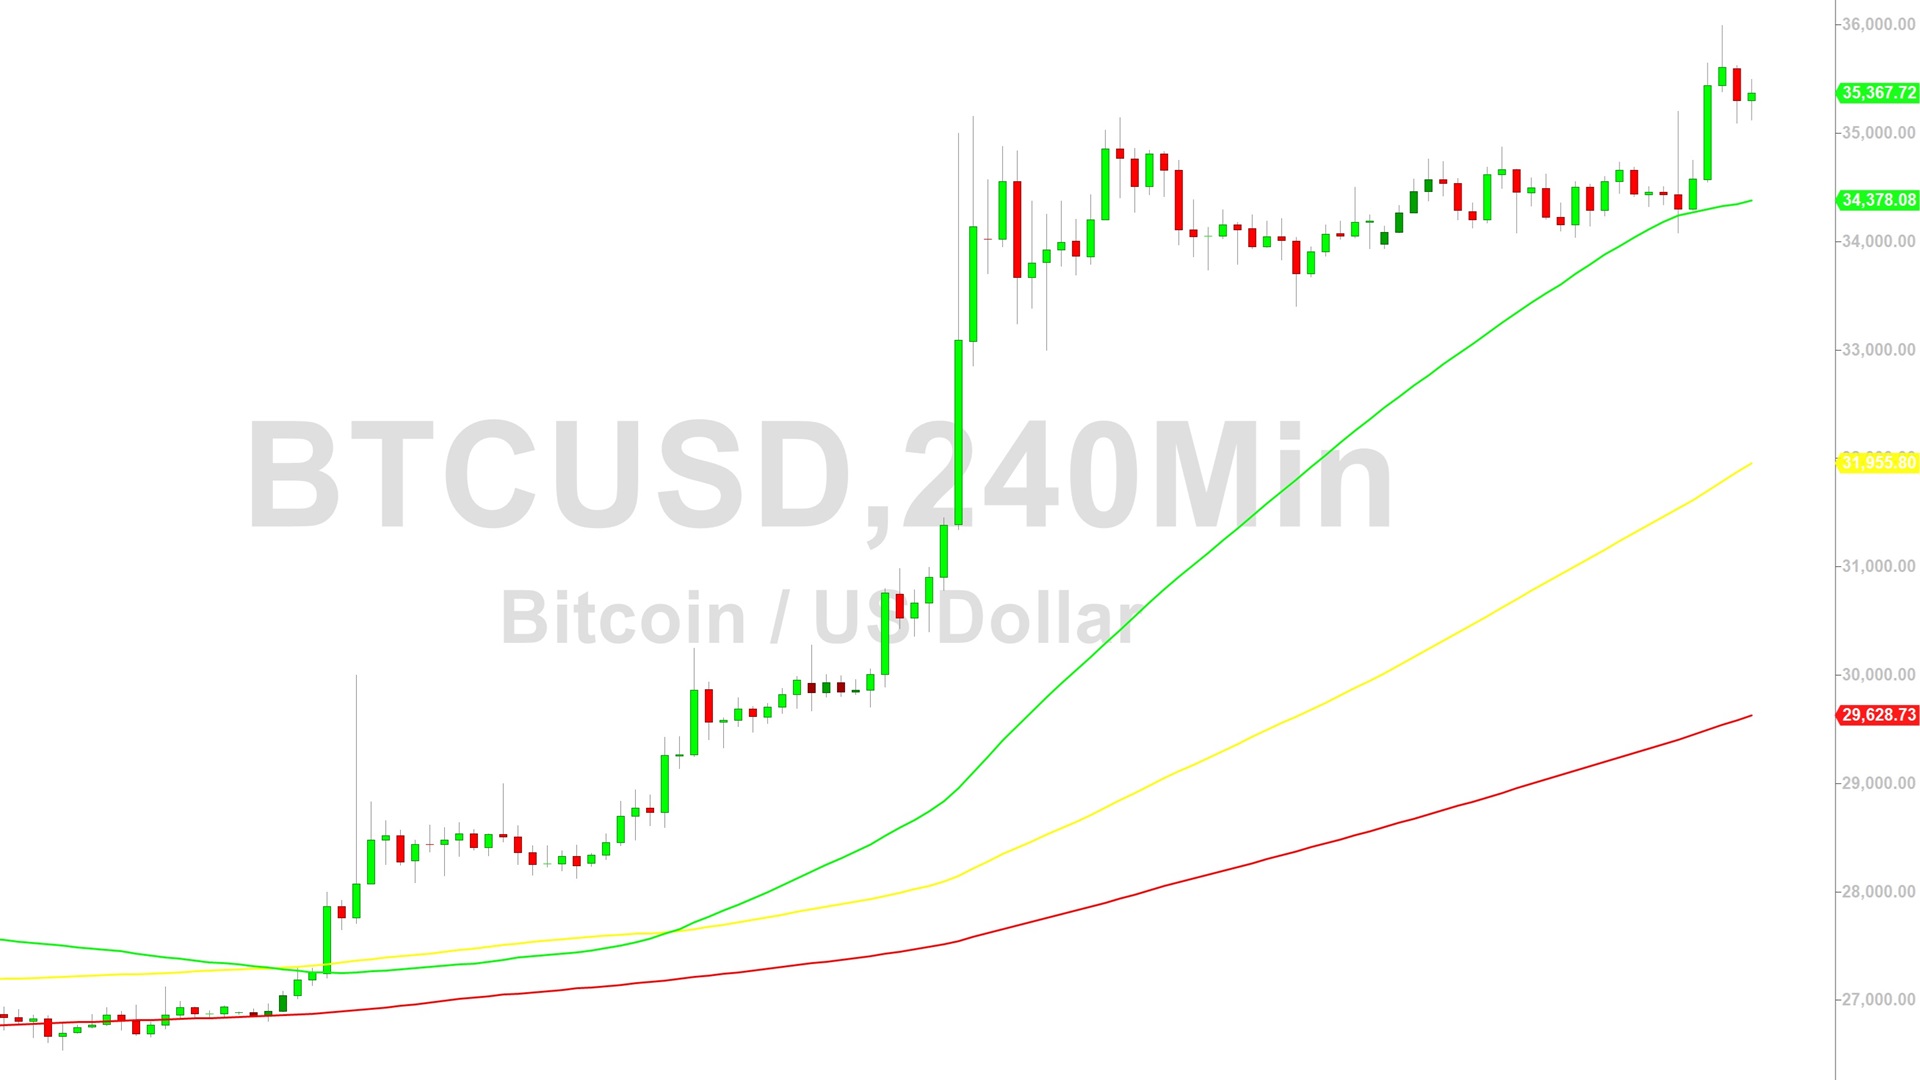
Bitcoin broke out on Monday with a big move to the upside, and what a move this was. A 7.75% gain on the day saw $BTC power to the top of the bull flag it had been in for the last 10 weeks. The bulls are now well and truly back in charge.
A sea change for the $BTC price
The last ten weeks must have sorely tried the patience of many, and weaker hands would likely have sold when $BTC was plumbing the depths at $56,000. However, this is the life of a bitcoin holder. Volatility is the name of the game, and if you don’t have conviction, $BTC will shake you out and your coins will go to someone else.
When the $BTC price launched itself towards the top of the bull flag on Monday, everything changed. The bull market has resumed, and to be honest, it never went away. The 23% correction was perfectly normal, and is in line with previous bull markets, if not somewhat less than the average 30%+ corrections of the past.
All this said, the $BTC price still needs to close outside of the bull flag by the end of this week. Failure to do so could even mean another descent into the $50,000s.
Why the price surge?
So what are the main reasons for $BTC enjoying this recent price surge? Number one could certainly be the market rumours that the SEC may actually approve the Ethereum Spot ETFs. Bloomberg analysts Eric Balchunas and James Seyffart announced on X yesterday that they were increasing the odds of an approval to 75% after hearing that the SEC was considering a 180 degree turn on its previous negative stance.
Granted that an Ethereum ETF is not related to BTC, but this kind of news floats all boats, and the entire crypto market erupted on the rumours.
A second reason for the surge in the $BTC price was perhaps the continued strong buying into the Spot Bitcoin ETFs. Last week was all about positive inflows, and nearly $1 billion entered the funds over the course of the week. Monday saw a further $237.2 million inflow, with even the Grayscale ETF recording a fourth straight day of positive inflows.
A third reason could be from a technical analysis perspective, in that the cross up from the bottom of the weekly stochastic RSI is supplying some rocket fuel to the $BTC price. These crosses only happen every 4 to 6 months, and when the indicator lines cross up from the bottom, this signals a lot of upside momentum.
$BTC not out of the woods yet
Source: Coingecko/TradingView
As can be seen in the daily chart above, the $BTC price is not out of the woods yet. There are a couple of ways of drawing the flag, and one way gives the impression that the price has already pierced through the top of the flag and is now well above. However, looking at the cleanest picture of the flag shows that the $BTC price is only at the top of the flag, and that there is the danger that it could come back down to the bottom again.
Next weekly close all-important
Source: Coingecko/TradingView
On the weekly time frame, it can be seen that not only does the price have to contend with the top of the bull flag trend line, but also resistance formed by the previous tops of the two candle bodies in March and April.
It may take a while for the price to get through these barriers, and a retrace into the middle of the bull flag might be necessary. Or, the price could just manage to hang around the present level, and then confirm a close above the bull flag and resistance, ready for the next big green candle that shatters the all-time high again. The weekly close will once more be an incredibly important point in time.
Disclaimer: This article is provided for informational purposes only. It is not offered or intended to be used as legal, tax, investment, financial, or other advice.


