Liquity price analysis reveals that the LQTY price is facing a significant amount of bearish pressure in today’s market. The bearish pressure is pushing the LQTY price lower, and the market sentiment seems to be negative. The LQTY/USD pair is currently hovering around the $1.25 mark, which is a drop of 3.87% in the last 24 hours. The Liquity token could potentially go as low as $1.24 if the bearish pressure continues to mount. The bulls need to act fast to push the LQTY price above the resistance level of $1.35 in order to restore the bullish sentiment in the market and prevent further downside price action. The bearish pressure is likely to continue in the near term as technical indicators suggest further downside momentum.
Liquity price analysis 1-day chart: LQTY enters correction at $1.25 as the bearish wave takes over
The 1-day Liquity price analysis has shown a downward trend in the past few days, indicating a bearish market sentiment. The token is trading around the $1.25 mark and could potentially go lower if there is no sign of buying activity in the near future. The market capitalization of LQTY is currently $15 million, which is low compared to the previous figures. The 24-trading volume for the LQTY/USD pair currently stands at around $15 million, with an increase of 68.1% in the last 24 hours.
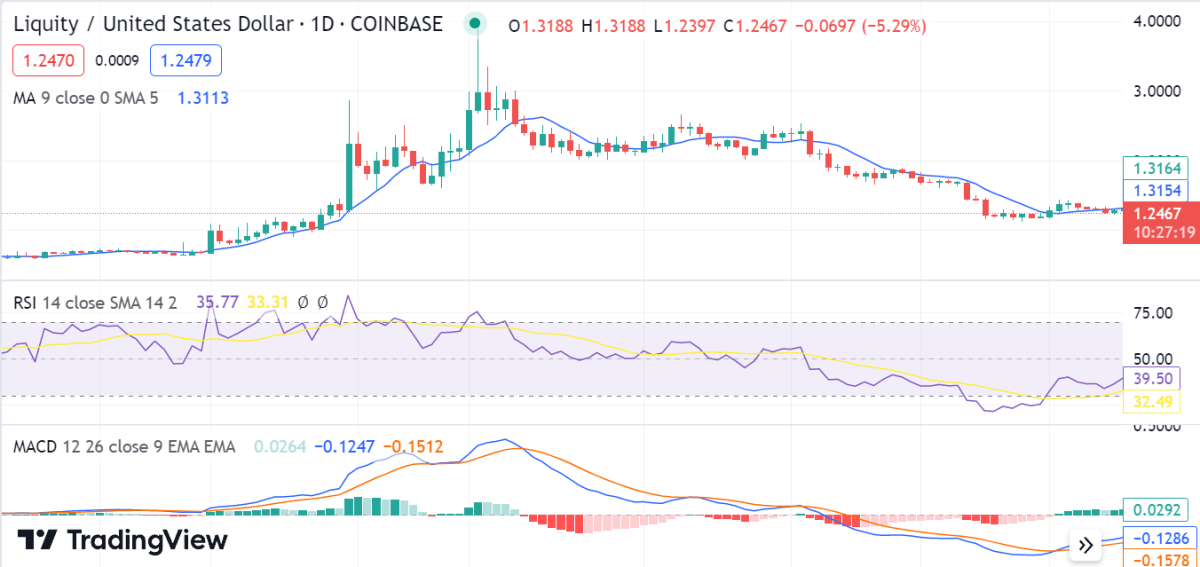
The daily chart for LQTY shows that the price is trading below both its 20-day and 50-day moving averages, which further confirms a bearish outlook in the short term. The histograms are red in color, with the signal line moving below the MACD line, which indicates that bearish momentum may persist in the coming hours. The indicators show that the market is in a bearish mood as the RSI has fallen below 50 levels, which indicates that the selling pressure is likely to continue in the near term.
LQTY/USD 4-hour price chart: Recent development and further technical indications
The 4-hour Liquity price analysis also confirms a bearish trend in the market. The price has been declining for the past few days, and it is now trading below the $1.25 level, which is a drop of 3.87 percent in the last 24 hours. The technical indicators are pointing toward further downside momentum, as they have been suggesting selling pressure for some time now. The market could potentially go lower if there is no sign of buying activity in the near future.
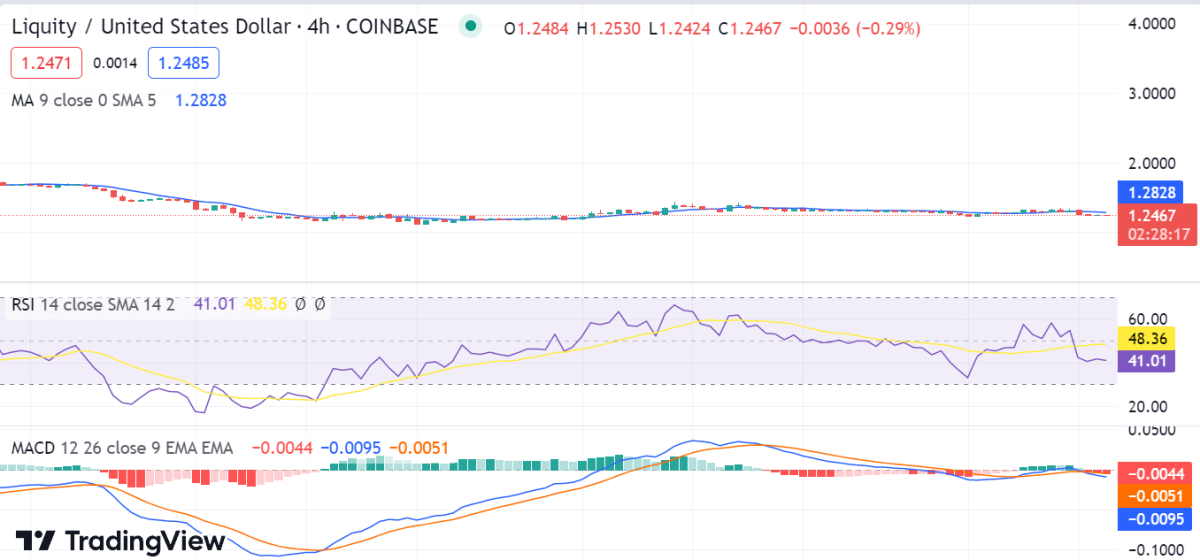
The hourly technical indicator is also in the bearish zone, with the RSI indicator below the 50 level. The RSI is currently at 41.01 and may move to the oversold zone if the bearish sentiment continues. The MACD indicator is also moving toward the bearish zone, which suggests further downside momentum. The moving average at $1.2828 is also above the current price level, which supports the bearish outlook for LQTY in today’s market.
Liquidity price analysis conclusion
Overall, Liquity price analysis shows that there is a bearish trend in the market, and it could potentially go lower if there is no sign of buying activity in the near future. The resistance level is around the $1.35 mark, and if the price breaks above this level, there could be some bullish pressure in the market. Investors should exercise caution before investing in this token, as the bearish trend could continue in the near term.