Liquity price analysis shows that the price is covering upward movement once again, as the bulls have been at the lead today as well. The past day had been highly favourable for the bulls as the price advanced at a rapid speed. Today, the trends have been no different as the price has increased up to the $1.26 level. Further improvement in LQTY market value can be expected as the hourly price chart predicts an uptrend as well.

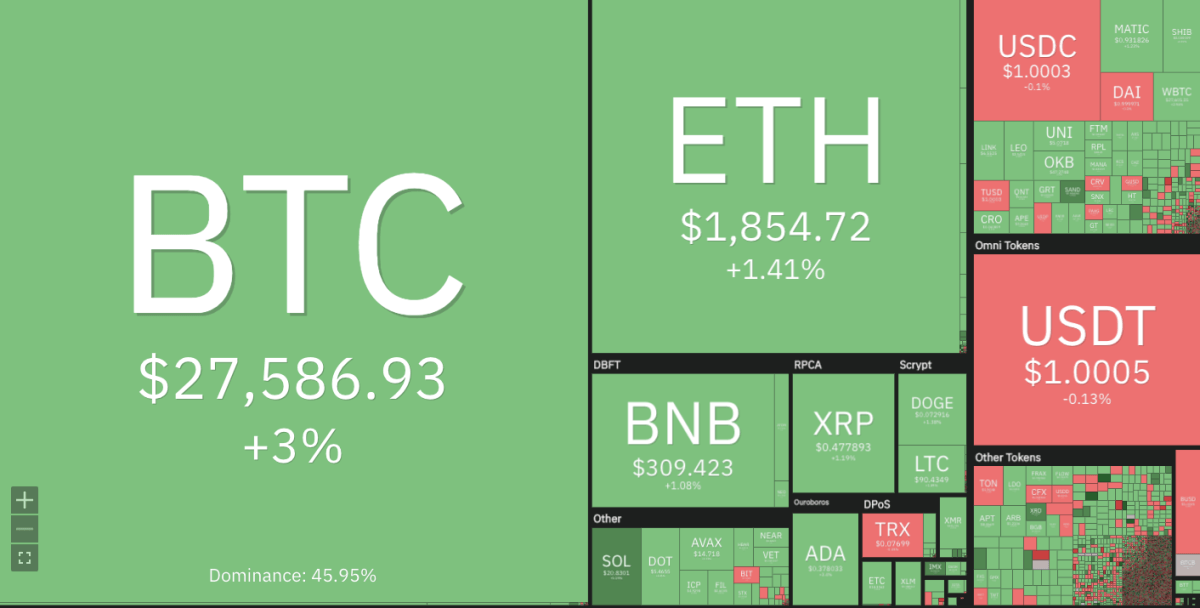
The price opened today, trading at $1.23, but the bull run was short-lived as the price corrected higher to reach the current level. The broader cryptocurrency market is also bullish today as Bitcoin shows a three per cent gain in value, standing at $27,586, Ethereum shows a 1.41 per cent gains with a $1,854 price tag, and most altcoins also reporting bullish market sentiment, with LQTY being no exception.
Liquity price analysis daily price chart: Bullish trend extends to $1.26
The daily chart of LQTY reveals a strong bullish trend in the market as the price continues to move higher. The Bulls have been in complete control of the market as they extend their control higher. The daily chart reveals a clear uptrend with resistance present at $1.27, but there’s also support at the $1.23 point to keep any downside movements in check. The 24-hour trading volume is reported at $9,006,834 million, with a decrease of 28.46% compared to the previous day, while the market cap stands at $116,709,808.

The Chaikin Money Flow (CMF) indicator is also providing a bullish outlook as it stands at 0.09, which represents an accumulation of capital in LQTY. The Moving Average Convergence Divergence (MACD) indicator also confirms a bullish trend in the market. The MACD line is currently above the signal line, and the histogram is positive, which suggests more gains for LQTY in the upcoming sessions. The Relative strength index (RSI) is at 38.17, which indicates that the market is neither overbought nor oversold.
Liquity price analysis 4-hour chart: Bullish pattern is being formed
The four-hour chart of LQTY reveals a bullish pattern being formed. The price is currently trading above the 50 EMA line, and a bullish crossover has been recently formed between the 12EMA and 26EMA lines. The support for the price is situated at $1.23, while the resistance is present at the $1.27 point, indicating a tight trading range in the price.

The 4-hour Chaikin Money Flow (CMF) is also in a bullish trend as it stands at the -0.08 mark, indicating capital accumulation in LQTY price. The Moving Average Convergence Divergence (MACD) is also in a bullish trend as the MACD line is currently trading above the signal line, and the histogram is positive. The Relative Strength Index (RSI) is currently at 51.63, indicating a neutral market sentiment.
Liquity price analysis conclusion
Overall, the Liquity price analysis shows that the bulls are in complete control of the market as they push prices higher. The daily chart reveals a strong uptrend with resistance present at $1.27 and support at $1.23 point, while the 4-hour chart is forming a bullish pattern. If the bulls can continue to hold the gains, more upside potential can be seen in the upcoming sessions. However, if bearish momentum starts to pick up, the support levels should help prevent any major downside movements.


