The current Liquity price analysis reveals a significant downturn in the price, as the LQTY bulls face notable challenges in the market. The price has been steadily declining at a faster pace, causing it to reach a new low of $1.211. Despite the bulls’ attempts to push the price higher in the previous session, they have struggled to overcome the prevailing bearish momentum that has gained strength today. At present, the bulls are focused on preventing the crucial support level at $1.897 from giving way to further downside pressure. This critical level holds the key to determining the near-term trajectory of Liquity’s price.
LQTY/USD 1-day price chart: Bears initiate their struggle for a lower price
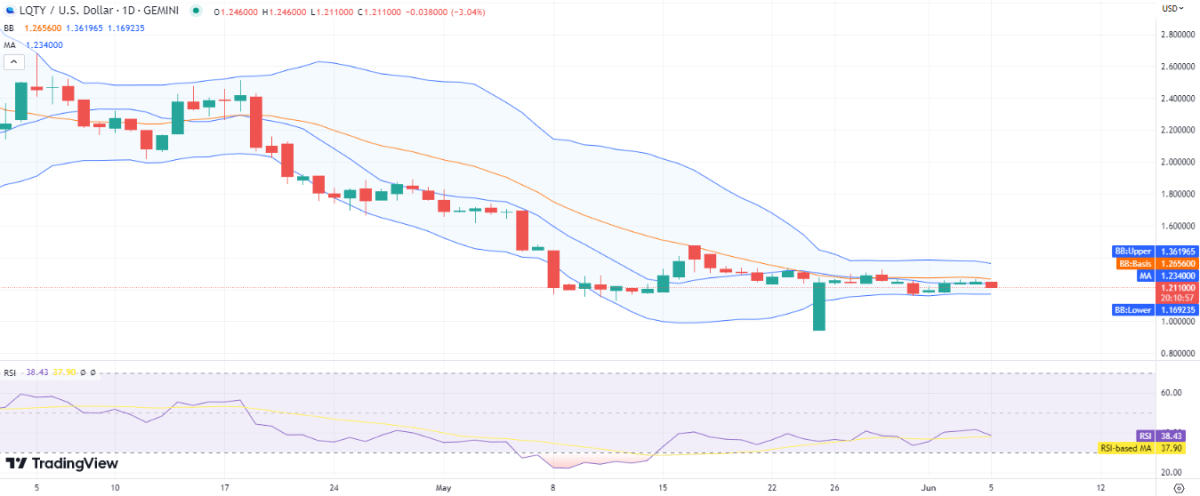
The 1-day Liquity price analysis indicates a decline in price as the bears make a comeback, challenging the bulls for dominance. Over the past four days, the cryptocurrency has experienced significant growth, with a continuous increase in price. However, today’s drop has been too substantial for the bulls to overcome. The selling pressure has been strong enough to push the price down to $1.211. Despite the bull’s lead in the previous week, today’s market conditions have caused the price to slip below the moving average (MA).

The current market conditions for LQTY/USD indicate low volatility, which is generally considered a negative sign. The Bollinger bands are reflecting this sentiment, with the upper band positioned at $1.361 and the lower band at $1.169. These values suggest a tight trading range and limited price movement. Additionally, the Relative Strength Index (RSI) score is decreasing and currently stands at 38, further indicating a strengthening bearish momentum in the market.
Liquity price analysis: Recent developments and further technical indications
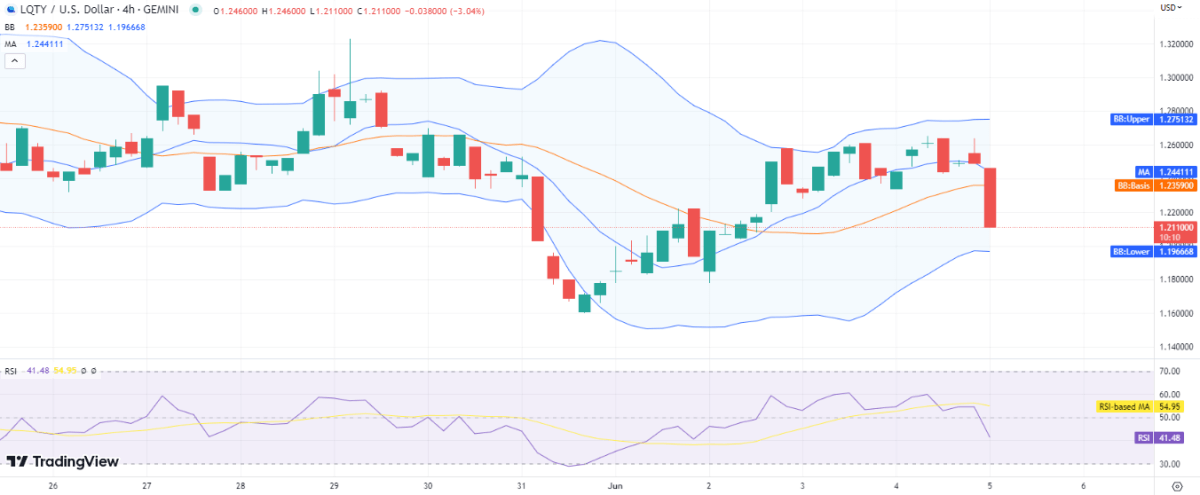
Based on the 4-hour Liquity price analysis, there is a significant bearish activity unfolding as the price dropped to $1.211 within the last four hours. This recent development has acted as a catalyst for the bearish trend, with no notable resistance from the bulls. The price has now fallen below both the moving average and the SMA 50 curve, with the former situated at $1.244 and the latter at $1.235.

The volatility has decreased, which is why the upper Bollinger band value is at $1.275 and the lower Bollinger band value is at $1.196 right now. Meanwhile, the RSI score has also decreased because of the bearish pressure and has moved down to index 41, as the steep downward curve of the indicator hints at high selling pressure in the market.
Liquity price analysis conclusion
The provided 1-day and 4-hour Liquity price analysis is indicating a bearish outlook for the day, as the bears have successfully pushed the price levels down to $1.211 once again. Although the bulls made attempts yesterday to exert their influence and drive the price higher, today’s price action has completely favored the bears, leading to negative movement. Despite the bulls’ efforts, the bears have regained momentum and are now targeting the critical support level of $1.897.


