Since the bulls are currently in control, the Litecoin price analysis is bullish today. Cryptocurrency has been able to fully recover from the severe losses it suffered on April 26, 2023. The price level has returned to $90.45 as bulls today demonstrated strong vigor. The price is getting close to the $91 resistance as the positive trend continues. Bulls, however, need power to push the price higher because selling pressure is also there at this level.
LTC/USD 1-day price chart: Price rises in an effort to recoup
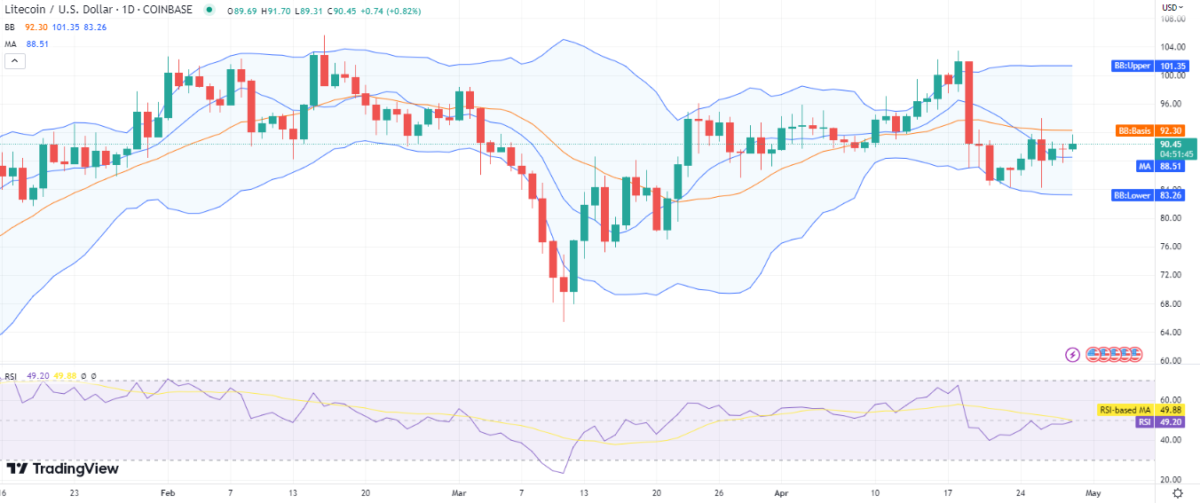
The one-day price chart for Litecoin price analysis shows that things are moving smoothly in the direction of a recovery of the coin’s value. Since the trend line has been moving up for the past week and the coin has gained nearly 4 percent in value during this time, the coin’s value has significantly increased over the last few days.
As the crypto pair is trading at $90.45 at the time of writing, additionally, it also reports a 1.19 percent rise in value over the previous 24 hours of price movement. The trading volume, on the other hand, has decreased by more than 29 percent over the past day, and the moving average (MA) is trading around $88 below the current price level.

The SMA 20 is going lower than the SMA 50 curve as steep corrections have been observed in the past two weeks. The 1-day chart’s volatility is likewise strong, suggesting that the bullish momentum may continue to build. The Bollinger bands show the upper band at $101, representing the resistance for the LTC price, while the lower band is present at $83, representing the strongest support for LTC/USD. With the continuous increase in price, the Relative Strength Index (RSI) also went up to index 49, which is quite impressive considering the heavy sell offs of the past few days.
Litecoin price analysis: Recent developments and further technical analysis
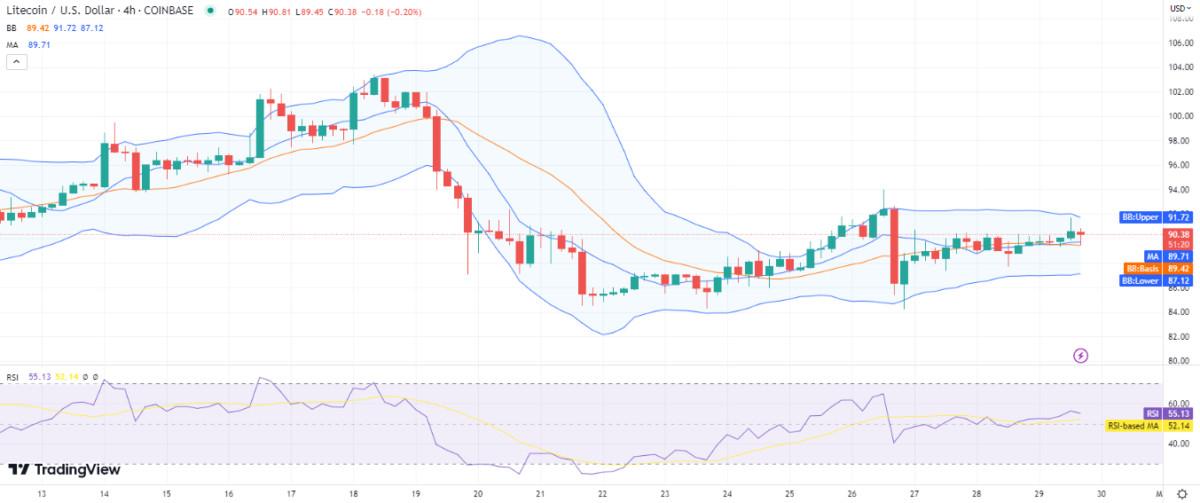
As the market displayed positive sentiment today, the 4-hour price chart for Litecoin price analysis is showing encouraging signs for the bulls. Bulls are pushing the bar higher after every drop according to the hourly trend, and the price is anticipated to cross the $91 resistance level, which is currently being tested. Currently, the price is under correction, but it is expected that bulls will make a comeback in the ensuing hours.

The Bollinger bands are showing slow convergence on the four-hour chart, with the upper value lowering to $91.72 and the lower one resting at $87.12. The upper band is showing more convergence, which hints at selling pressure being higher above the $90 level. The RSI curve traveled down during the last correction, and now the score has slightly decreased to index 55, indicating selling pressure in the market.
Litecoin price analysis conclusion
The price levels throughout the past week have fluctuated at different times, but bulls have been able to hold onto their lead, according to the Litecoin price analysis presented above. The corrections that were seen during that period, nevertheless, were also necessary for the LTC to continue moving upward. Despite the bearish momentum, the LTC managed to overcome the $90 local resistance by gaining strength. There is a strong possibility that cryptocurrency may break above $91 in the following trading session if the current bullish trend continues, as we anticipate it will.


