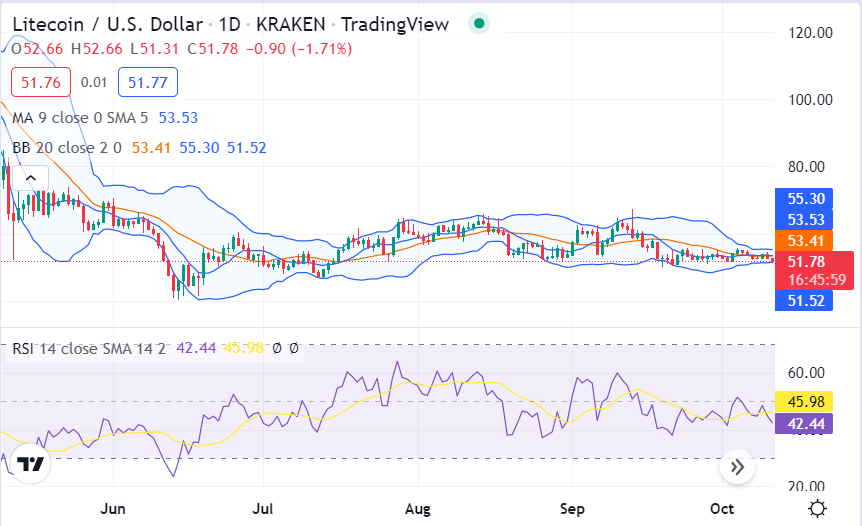
Litecoin price analysis confirms that a bearish trend has been dominating the charts for the past few days. A decrease in price levels has been observed in the last 24 hours as well, which is quite discouraging for the buyers. The price has been corrected down to the $51.98 level, as the bearish momentum continues for two days of downfall activity. Although the price has experienced a downfall recently, the bulls are still struggling to take control of the market; if the price breaks above the $54.27 resistance level.
The Digital asset has lost over 3.90% in the last 24 hours, and it is currently trading below the $54 level. The coin has a market capitalization of $3.96 billion and is ranked 20th on CoinMarketCap.The 24-hour trading volume of the cryptocurrency is $389 billion.
LTC/USD 1-day price chart: Bearish pressure takes the price beyond $54.27 fence
The 1-day Litecoin price analysis dictates that a decrease in price has taken place in the last 24 hours. The circumstances have been going favorable for the bulls for the past week. But the last few days of the start of this week have seen a fluctuation in price movements, as well as the bears were struggling to regain their position. Today’s trend, however, has been extremely supportive for the sellers as the price has decreased up to the $51.98 level.

The moving average (MA) value in the one-day price chart is at the $53.53 level. Whereas the Bollinger band’s average is maintained at $53.41, the upper Bollinger band is touching $54.98 point, and the lower Bollinger band is touching $51.56 point, representing the strongest support. The Relative Strength Index (RSI) score has slightly decreased up to an index of 45.98, but the downwards curve is not steep.
Litecoin price analysis: Recent developments and further technical indications
The hourly Litecoin price analysis is showings signs of a bearish trend as well, as the price has dropped down to a significant level. The trend reversal was quite unexpected, as the bulls were leading the price chart last week. Nonetheless, a downward trend has been observed in the last four hours.

The price has gone below the moving average value, i.e., $53.13, as a result of the bearish trend. The upper Bollinger band value for the four hours price chart is at $54.21, whereas the lower Bollinger band value is at $51.75. The RSI score is in the neutral zone, as it shows the figure of 46.99 just below the centerline of th neutral zone.
Litecoin price analysis conclusion
To conclude, Litecoin price analysis shows that the market has followed a downward trend for the day. The price has decreased to an extent and is now touching the $51.98 mark. On the other hand, a drop in LTC/USD price was detected in the last four hours as well, which means that the approaching hours might bring loss. However, if the market sentiment changes, then a reversal in trend can also be expected as the loss is on the lower side.
Disclaimer. The information provided is not trading advice. Cryptopolitan.com holds no liability for any investments made based on the information provided on this page. We strongly recommend independent research and/or consultation with a qualified professional before making any investment decisions.


