Given the sharp decline in price, the most recent study of the Litecoin price analysis indicates a bearish trend. LTC/USD’s value has decreased over the last few hours to $86.51 as bears were unable to establish support. If we examine the price difference that has occurred over the last few hours, we can see a consistent bearish drift. Red candlesticks are predominate on the current chart showing the price of Litecoin, and the resistance has been lowered to the $90 mark due to the persistent pressure from the sellers.
LTC/USD 1-day price chart: Bearish market signs are visible on the daily chart
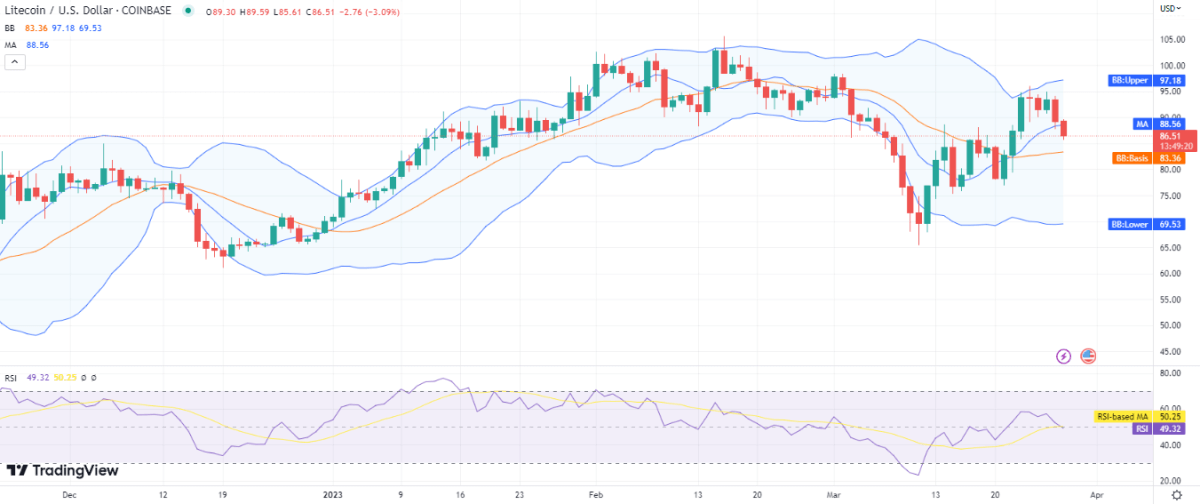
The overall picture and general study of the Litecoin price analysis indicate that the bears have been very resilient over the last few days. Since the price has been falling for the past two days, bears have significantly reduced the coin’s worth as the price has fallen to $86.51. The Moving Average Indicator (MA) is present at the $88.56 level which is also above the current price level, showing a bearish inclination.

The overall average value shown by the Bollinger bands is $83.36. The $97.18 level of resistance is where the Bollinger bands show their highest point. The Litecoin price research confirms that the lowest Bollinger band value, which represents the strongest support in the current situation, is set at $69.53 standard. The downward-sloping curve of the relative strength indicator (RSI), which is 49, indicates that sellers are active in the market.
Litecoin price analysis: Recent developments and further technical indications
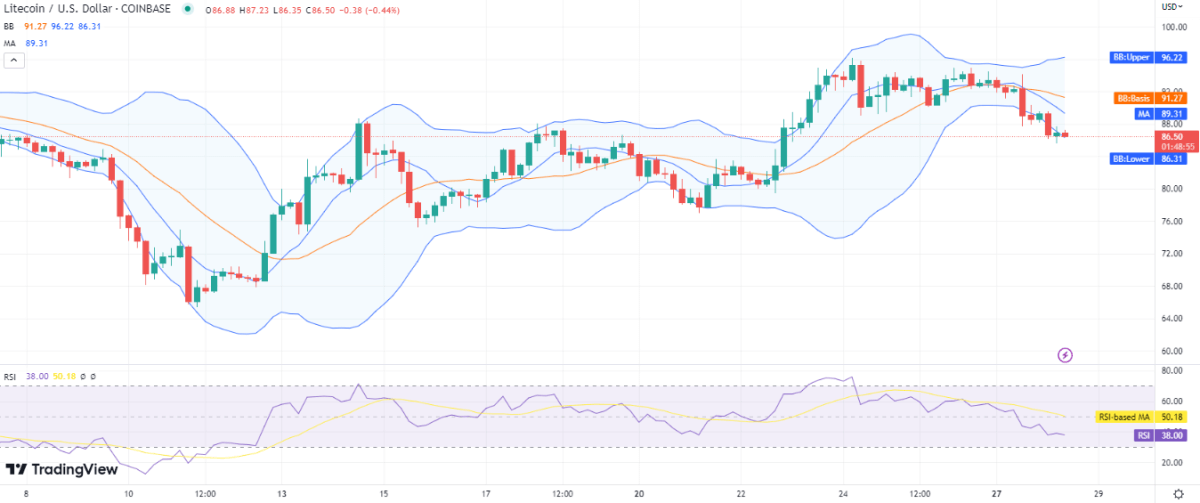
For today’s buyers, the hourly Litecoin price analysis shows depressing findings. The Bollinger Bands indicator is progressively widening and suggests that total cryptocurrency volatility will rise. Given that today’s trend has been predominantly bearish, there is a good chance that the high volatility will either create the conditions for a positive upswing in the near future or will reinforce the current bearish pattern. According to the data below, the average value of the Bollinger bands on the four-hour chart is currently sitting at $91.

Moving on to the data of the moving average indicator, we see that the MA is present at the $89 level, above the price level but below the SMA 50 curve. The Bollinger bands’ two ends give us the following values; the top band is set at $96 and the lower one is fixed at $86.31. The RSI value is 38, which is lower than normal, and if the selling pressure persists, there is a good chance it will cross the underbought line.
Litecoin price analysis: conclusion
It is confirmed that the most recent Litecoin price analysis is in a bearish direction. On the one-day LTC/USD chart for today, a barrier can be seen at a specific price—$90. The charts show that volatility is steadily rising, making it harder for us to predict precise future trends, but it is largely in the bears’ favor given that recent days have seen more bearish retracements. If the LTC/USD price maintains the current support level, then there is an adequate chance that it will start improving from there.


