The current Litecoin price analysis is showing a relatively greater level of bullish momentum as the LTC/USD pair has surged to break above the $54.80 level. The price is now trading very close to the $55.26 resistance area, which is likely to provide some significant selling pressure in the near term. The support for the crypto pair has been raised to the $52.22 level.
The LTC/USD pair is currently trading in a strong uptrend as the coin has increased by over 3.89% in the past 24 hours. This has been possible due to the recent surge in the market that has been witnessed over the past few days. Most of the altcoins and Bitcoin and Ethereum are all under correction today, at least at present. At the same time, Litecoin is showing some promising bullish movement which is a hopeful indication for the buyers.
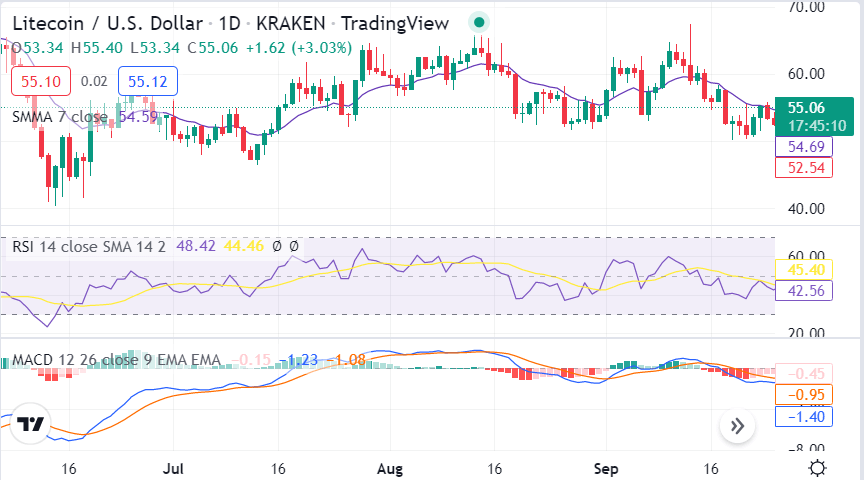
Litecoin price action on a 1-day price chart: LTC/USD prices continue to surge past $54.80
The one-day chart for Litecoin price analysis indicates a surprising increase in the price levels today. The bulls have been able to break past the barrier created by the sellers at $54. The LTC price has surged to trade at $54.80, which is a new high for the coin. The bears were in control of the market yesterday as they had pushed the prices down to $52.30. The buyers, however, have managed to turn things around and are currently in control of the market.

The Relative Strength Index for the LTC/USD pair is currently placed just below the overbought territory as the price action is losing some Momentum. The RSI is well at 45.40. The MACD indicator is currently in the bullish zone as the signal line is above the histogram. The 50-day and 200-day simple moving averages are placed quite close to each other at $55.06 and $52.54 respectively, which is a sign of indecision in the market.
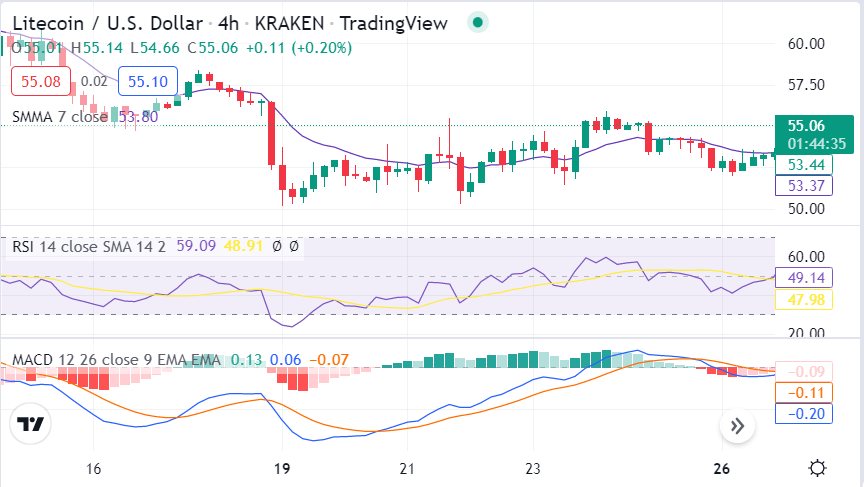
Litecoin price action on a 4-hour chart: LTC/USD corrects higher after hitting $54.80
The 4-hour Litecoin price analysis indicates that cryptocurrency has gone through an uplift which has taken the price value to $54.80. The last hours have been highly profitable for the buyers as the bullish candlestick continues to grow, highlighting bullish momentum. Yet, in this hour, the price has gone through a major shift as it has crossed the $54.00 level.

The MACD indicator is likely to see a bearish crossover as the signal line is slowly moving towards the histogram. The RSI indicator for the LTC/USD pair is placed at 47.98, which indicates that the market is currently overbought and might face some selling pressure in the near term. The 50-day simple moving average is placed at $55.06, while the 200-day simple moving average is placed at $53.44, which indicates that the market still has a long way to go before it can be considered bullish.
Litecoin price analysis conclusion
From the one-day and four hours of Litecoin price analysis, it can be inferred that the trends have been greatly in favor of the bulls. The price has reached $54.80 today, as the buyers have contributed well enough to make this possible. The support levels have also been maintained at $52.22, which gave the bulls an edge to move forward easily. The resistance at $55.26 is almost near the actual price value and can be crossed soon as per the predictions.
Disclaimer. The information provided is not trading advice. Cryptopolitan.com holds no liability for any investments made based on the information provided on this page. We strongly recommend independent research and/or consultation with a qualified professional before making any investment decisions.


