Litecoin price analysis shows that the coin is currently in a strong bullish trend as prices surged above the $53 mark. However, Litecoin’s price is now facing rejection at $53.96. The LTC market has been on an uptrend for the last 24 hours as prices exceeded the key support level of $51.49. The buyers have been in control of the LTC market for the last few days as prices surged from the $51 level to the current level.
The digital asset has increased by over 2.97 percent in the last 24 hours and is currently trading at $53.11. The LTC market has a market capitalization of $3.87 billion, and the 24-hour trading volume is $421 million.
LTC/USD daily price chart analysis: LTC Prices in a bullish trend
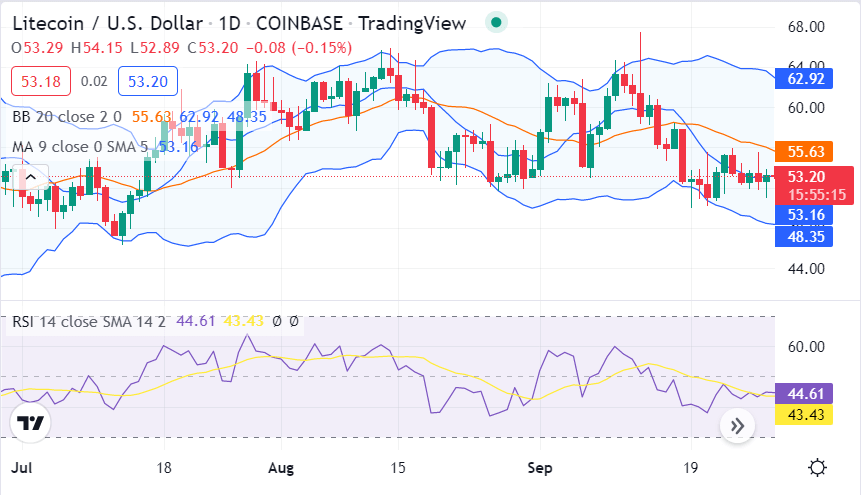
The one-day Litecoin price analysis is showing signs of an uptrend as the price has been increasing for the last two days. There have been instances where the bears gained dominance, but the bulls have been at the lead from an overall view. The LTC/USD price has also covered upward movement in the last 24 hours and is now at the $53.11 level. Whereas the moving average (MA) value in the one-day price chart is at the $53.16 level.

The upper limit of Bollinger’s band is present at $53.96, which serves as a resistance point for LTC. Conversely, the lower limit of Bollinger’s band is current at $51.49, which serves as another support point for LTC. The Relative strength index(RSI) is currently near the overbought levels, indicating that the prices might correct lower soon.
Litecoin price analysis on a 4-hour price chart: Prices trying to move higher
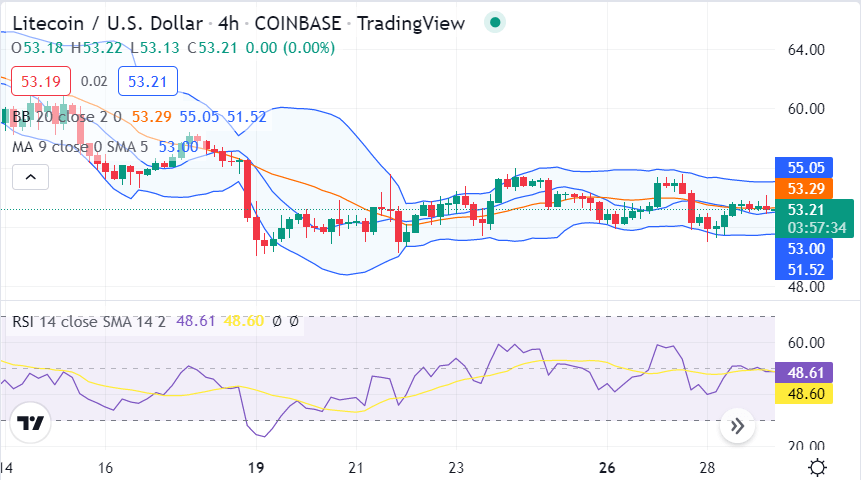
The four hours Litecoin price analysis confirms an uprise in price as the bulls have been persistently at the lead. A rise in LTC/USD price has been recorded in the last four hours, and the price has jumped to the $53.11 level. It can be estimated that the price will also move over the $53.96 resistance and mark further heights. The Moving average on a 1-day price chart is currently at $53.00, which is a good support level for the market.

The Relative Strength Index (RSI) for LTC is currently at 48.60, which is currently above the overbought zone. The RSI indicator is rising, suggesting that the bulls are still under market control. Both Bollinger bands for LTC are relatively close together, which suggests that the market is not overbought or oversold.
Litecoin price analysis conclusion
The one-day and four hours Litecoin price analysis supports the bulls for the day as the price has successfully joined the $53.11 level. The price recovery in the last four hours has also been quite extraordinary and has provided an edge to the buyers for further growth. The strong support at $51.49 also contributes to the steady price flow.


