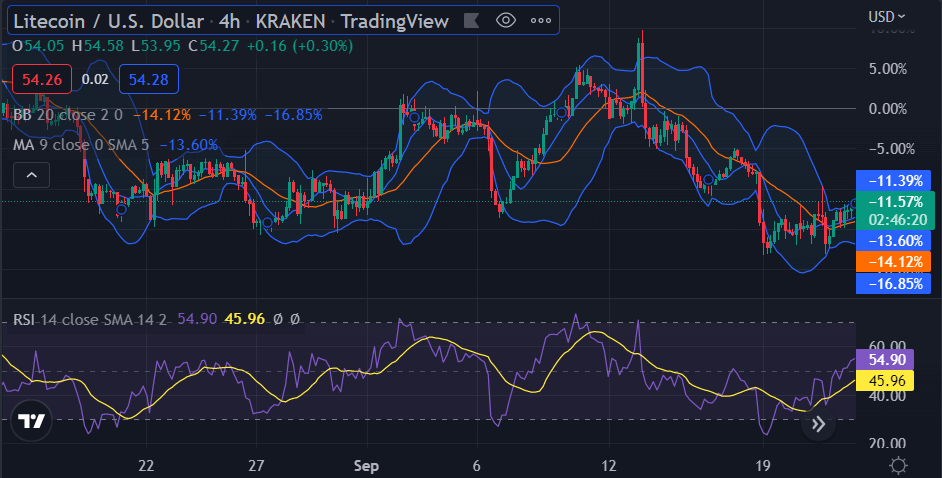
The latest Litecoin price analysis shows signs of a bullish trend as the price has undergone a significant increase today. LTC price capped at $52.37 yesterday, but today, it broke above the crucial resistance of $54.50, which is a good sign for the bulls. The bullish upswing has improved the price further as its value has upgraded to $54.48
LTC/USD 1-day price chart: Price continues soaring for the second day
The 1-day Litecoin price analysis shows the price function is upward for today. The price has increased, and the coin is trading hands at $54.48 at the time of writing. The increment in price level is significant as the cryptocurrency has gained 4.97 percent during the last 24 hours. The crypto pair also reports a 14.35 percent increase in value over the past week. We expect that the price will elevate further during the day. The LTC/USD has successfully maintained the upwards trend line this week, as continuous green candlesticks are appearing for LTC.

The volatility also increased, and the Bollinger Bands average has come to $54.00. The Bollinger Bands’ upper end stands at $54.50, representing the strongest resistance, while its lower end is at $51.81, representing the strongest support. The Relative Strength Index (RSI) has also increased to 47.44 after today’s bullish efforts, as the indicator nears the overbought region. The Moving average(MA) also indicates a bullish crossover, as it is currently at $50.82.
Litecoin price analysis: Recent developments and further technical indications
The price broke downwards at the start of the day’s trading session as prices endured a correction. However, the bulls managed to retain their stronghold. The price levels are expected to increase in the coming hours. The 4-hour Litecoin price analysis also confirms the bullish trend as we have seen a good increase in LTC/USD price value. Although the bulls controlled market trends, the bears also hindered the price function, as we saw a correction about four hours ago.

The price covers the range upwards again as it trades near the upper limit of the volatility indicator. The price is now present at $54.48 due to the latest bullish activity. The moving average value is presently at $54.2. The volatility is on the higher side. The upper end of the Bollinger Bands Indicator is at $54.50, whereas its lower limit is $51.81. The RSI score has also improved to an index of 45.96 after the price soared over the last four hours.
Litecoin price analysis conclusion
The Litecoin price analysis is bullish today. Even though we saw a brief correction earlier, we have not seen any further bearish activity throughout the day. Even bullish momentum has escalated during the last four hours. We expect the price to continue surging upwards towards the $55 mark in the next few hours.
Disclaimer. The information provided is not trading advice. Cryptopolitan.com holds no liability for any investments made based on the information provided on this page. We strongly recommend independent research and/or consultation with a qualified professional before making any investment decisions.


