Litecoin price analysis suggests a strong bullish trend for today as the price has improved significantly in the last 24 hours as the bulls are continuing to rule the market for LTC despite the bearish momentum that was present the previous day. The price has increased up to $88.05 today, making new highs and surpassing the previous resistance of $86.41 as the bulls have been pushing the prices higher since yesterday morning when it was trading below $87.00 levels.
The immediate resistance for Litecoin is present at the level of $91.62 which if breached could lead to further upward momentum and the price can move toward $92.62. On the downside, strong support is present at the level of $87.55 which is acting as a cushion for Litecoin from a fall.
Litecoin price analysis 1-day price chart: Bullish trend escalates, marking higher gains
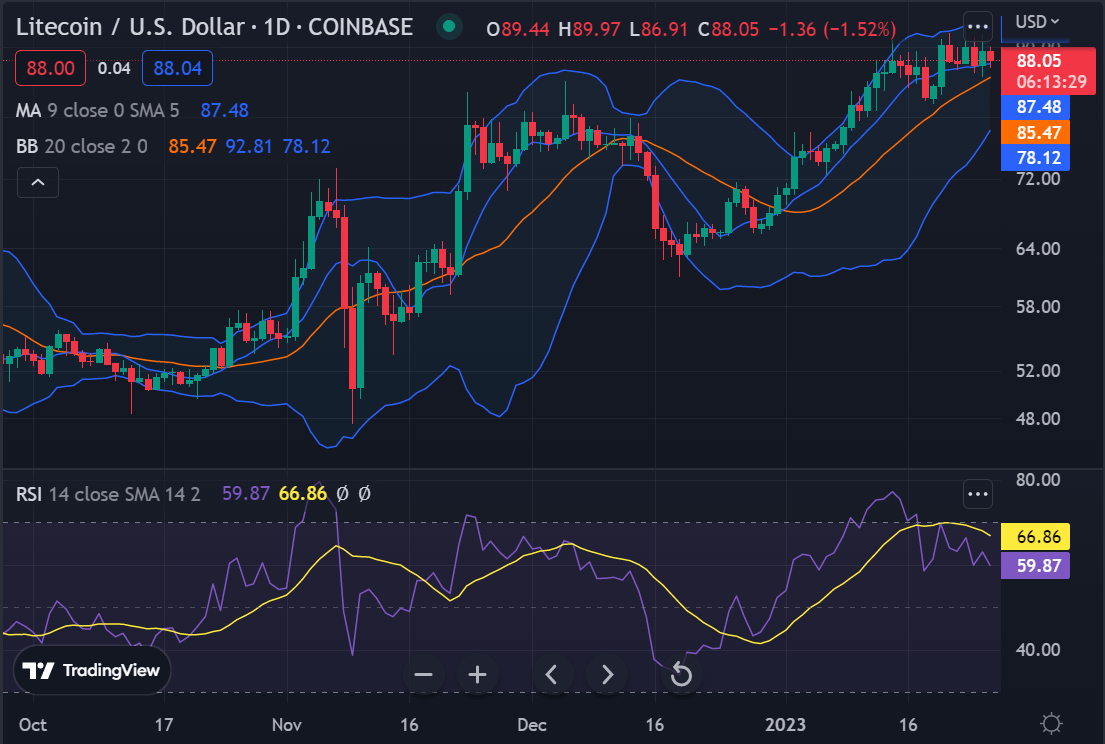
The one-day price chart for Litecoin price analysis shows a strong bullish trend for the cryptocurrency as it has made further gains in the past 24 hours. Currently, the LTC/USD has gained more than 1.02% in the past 24 hours and is trading at $88.05 making highs of $92.00 during the day. The trading volume is also high with over $594 million being exchanged as the bulls continue to take control of the market, while the market cap stands at $6.34 billion.

The moving average (MA) is also trading on an upwards line and is present at $87.48 above the SMA 50 curve. The volatility is increasing with Bollinger bands expanding, thus indicating a strong bullish trend for Litecoin. The upper Bollinger Band is present at $92.81, while the lower Bollinger band is at $78.12, indicating further upside in the prices of Litecoin. The Relative Strength Index (RSI) score has also been increasing for the past few hours, and the indicator has reached index 66.86; the upwards curve of the indicator hints at the buying activity of the LTC assets.
Litecoin price analysis 4-hour chart: Recent updates
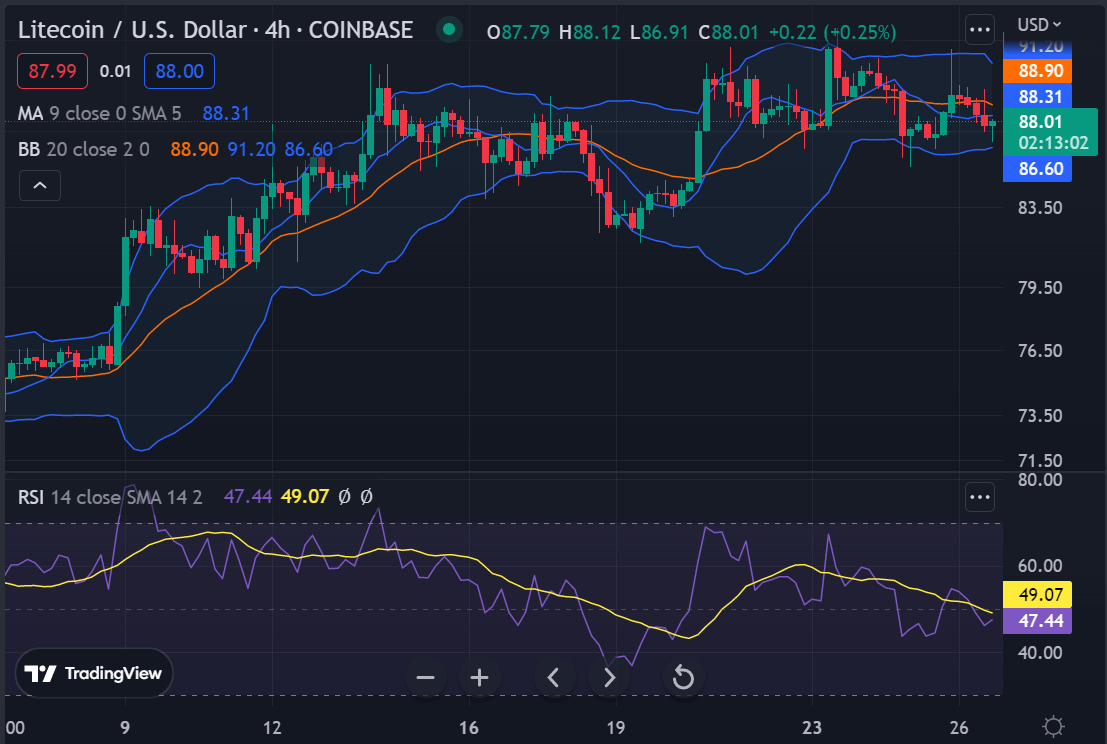
The 4-hour Litecoin price analysis shows the bulls have made a significant comeback in the last few hours, as the price has made a sudden spike, although the previous hours were also supportive for the bulls as the price has been increasing. The situation favors the buyers, as the price has now increased to $88.05. If we discuss its moving average value, then it is resting at the $88.31 position for now.

The volatility is increasing as the Bollinger bands cover more area, which means that the bulls might continue ruling in the upcoming hours. The upper limit of the Bollinger Bands Indicator is now at $91.20, whereas its lower limit is present at $86.60. The RSI curve is in the neutral zone but is moving towards the overbought region as the score has increased up to 49.07, and the indicator’s curve is still upwards.
Litecoin price analysis conclusion
The Litecoin price analysis shows the bulls have been gaining ground in the past 24 hours, and the prices are likely to continue their upward trend. The market is heavily bullish at this point and is expected to continue its positive momentum due to increased buying activity.


