Litecoin price analysis for today shows the prices have entered a bullish trend for the past 24 hours. The prices have been trading above the $51.97 support level and are currently facing resistance at $54.17. The prices had dipped to lows of $51.97 yesterday before the market corrected its high. The market is currently trading in a bullish trend with prices expected to continue rising to new highs. The prices opened the daily trading session trading low at $52.56 and have corrected to highs of $54.17.
The market is expected to continue its bullish trend in the near term with prices expected to retrace to their previous highs of above $53. The digital asset is ranking in position 20 on the CoinMarketCap list with a market capitalization of $3.81 billion and a trading volume of $389 million in the past 24 hours.
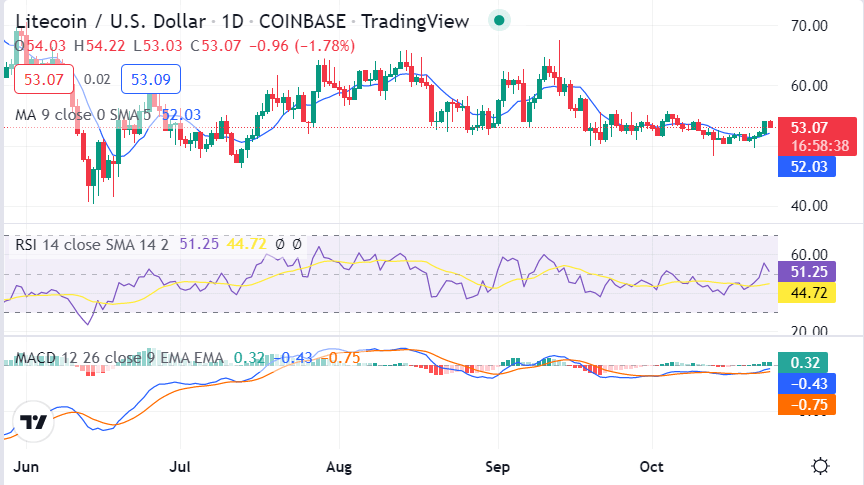
Litecoin price action on a 1-day price chart: Bulls continue to push prices higher
Litecoin price analysis shows that the Cryptocurrency has gained over 2.46 percent in the past 24 hours as it hits highs of $53.50. Litecoin has formed a short-term upwards trendline, which is currently providing strong support near the $51.97 level. The price may bounce back from this support level in case of any bearish pressure.

The bullish efforts have taken the price levels near the Moving Average (MA) value, i.e., $52.03. The LTC/USD price appears to be crossing over the Moving Average curve as the prices are trading well above the MA50 and MA200 curves. The MACD indicator is currently in the bullish zone, and the signal line is also gaining ground above the MACD line. This suggests that the buying sentiment is likely to continue in the market in the near term. The RSI indicator for Litecoin is currently trading at 44.72, which suggests that the prices are neither overbought nor oversold in the market at the moment.
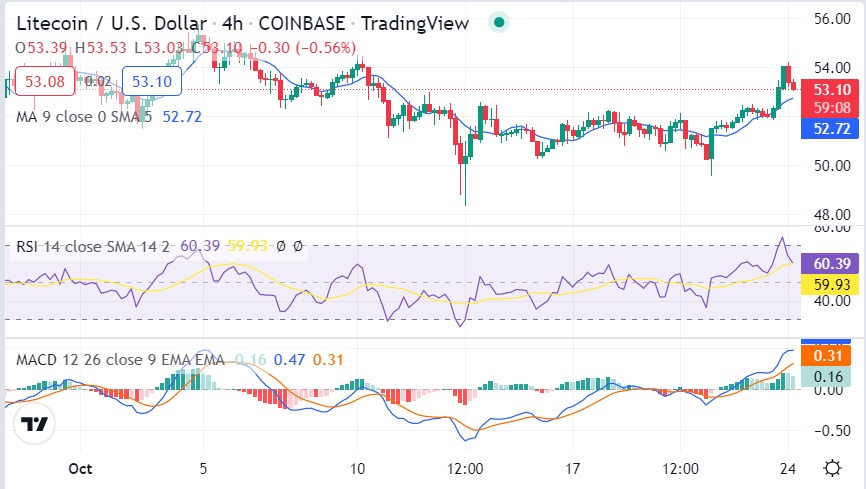
LTC/USD 4-hour price analysis: Latest developments
Litecoin price analysis on the 4-hour timeframe shows that the prices are currently trading inside an ascending channel. This is a bullish continuation pattern that typically signals further upside potential in the market. The bulls need to push the prices above the $54.17 resistance level to invalidate the bearish pressure in the market and open up further upside potential.

The MACD in the 4-hour timeframe is currently above the signal line, which suggests that the buying sentiment is likely to continue in the market. The Relative Strength Index curve is currently trading just below the 60 level, which suggests that the prices may face some selling pressure in the near term. The MA indicator curves are currently trending upwards, which suggests that the market is in a bullish trend.
Litecoin price analysis conclusion
In conclusion, Litecoin price analysis indicates the market sentiment has shifted to the bullish zone as the market looks to make a run toward the $54.17 price level. The market is recovering from the recent market crash seen in the previous week and is expected to continue its upward trend in the near term. The prices will need to stabilize above the $54 level before any further upside potential can be expected in the market.
Disclaimer. The information provided is not trading advice. Cryptopolitan.com holds no liability for any investments made based on the information provided on this page. We strongly recommend independent research and/or consultation with a qualified professional before making any investment decisions.


