The most recent Litecoin price analysis shows a bullish trend for the digital currency. The price of LTC has been increasing steadily for the past week and currently stands at $92.77 as of writing time. LTC has gained 1.53 percent in the past 24 hours while the weekly gain stands at 17.47 percent. Currently, LTC/USD pair is facing resistance at the $92.86 level and support is seen forming at the $89.68 mark. The buyers need to break past the $92.86 level to push the LTC price higher and toward the next resistance at the $95.15 mark. On the flip side, if there is a pullback in prices, LTC/USD pair will find support near $89.68.
Litecoin price analysis 1-day chart: LTC uptrend pattern still on the move
On the daily chart, Litecoin price analysis shows a solid uptrend pattern. The price is on the rise despite some minor pullbacks from the $90.00 level. The 24-hour trading volume is also healthy and stands at $613 million an increase of 6.07 percent compared to yesterday’s volume. The market cap for LTC is also on the rise and stands at $6.76 billion which is an increase of 1.63 percent in the past 24 hours.
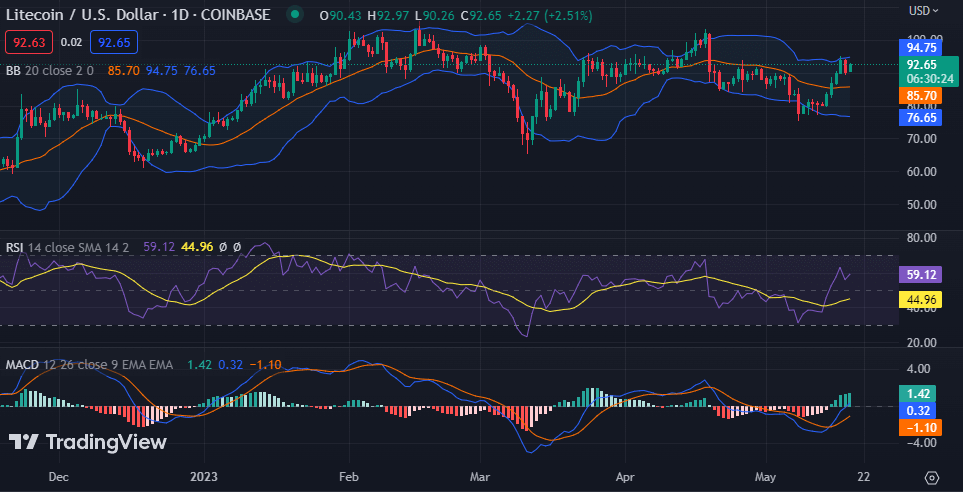
The technical indicators are looking bullish on the daily chart. The Moving Average Convergence Divergence (MACD) indicators show continued bullish momentum with the histogram and signal line moving higher. The RSI is also positive with a value of 59.12, indicating that there is enough buying pressure in the market to push prices higher. The Bollinger Bands are still widening which is another sign of a bullish trend and suggests that the price could go higher in the near term.
Litecoin price analysis 4-hour chart: Latest developments
The hourly chart for Litecoin price analysis shows a slight pullback in prices from the $92.00 mark. to the $91.00 level before bouncing back up again. The buyers and sellers are currently battling it out at the $92.55 level with buyers attempting to push prices higher and sellers trying to drag them down.
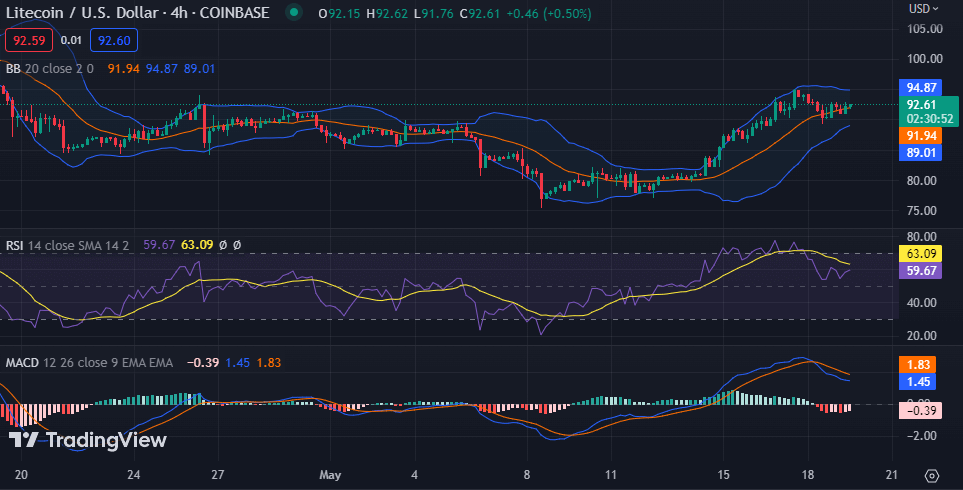
The technical indicators are looking bullish on the 4-hour chart as well but losing some of their strength. The MACD is in the negative region but is losing its strength and the signal line is also heading lower. The RSI has changed its upward slope and currently stands at 59.67 suggesting that there could be some bearish pressure in the market if the buyers fail to push the price higher. The Bollinger Bands are also narrowing which could indicate a possible pullback in prices in the near term.
Litecoin price analysis conclusion
Overall, Litecoin price analysis is bullish and LTC/USD pair is likely to go higher if the buyers can break past the $92.86 resistance level. In case of a pullback, $89.68 is the level to watch as it could offer some support for the LTC/USD pair. However, the technical indicators on the hourly chart are losing strength which could signal a possible pullback in prices.