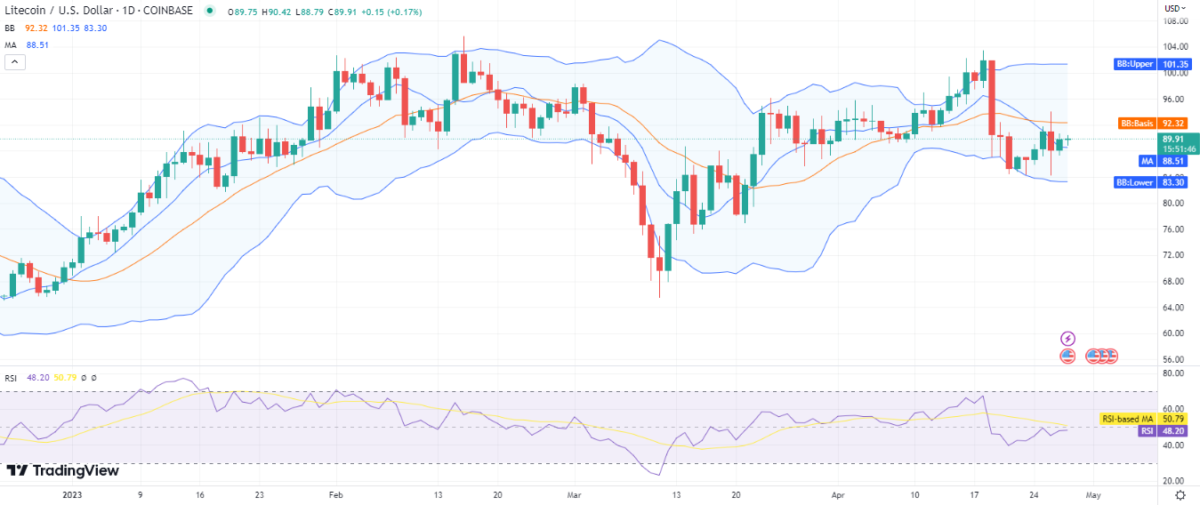
The Litecoin price analysis is indicating a rise in the price today. Following the previous trading session, when bulls took the lead, price levels have risen once more, continuing the bullish trend. Following a small price increase, the coin’s current value is $89.91. Although there has been some bearish action over the last few hours, bulls have been in the lead overall. Although there has been a slight uptick in price today, there is still a chance that it could turn bearish soon because selling pressure also surfaced in the previous hour.
LTC/USD 1-day price chart: LTC increases by 1.06 percent.
The 1-day price chart for Litecoin price analysis shows Since buyers have once again demonstrated their dominance, the cryptocurrency analysis is moving in a bullish direction today. The price has increased to $89.91 as the coin gained 1.06 percent in the last 24 hours. Although not particularly strong, the bullish momentum has managed to avoid being overtaken by the bearish momentum. As the trend has been mostly upwards during the past week after the crashing corrections stopped, the coin gained significant value over the past seven days, decreasing the loss to only 0.02 percent for the said time frame. The moving average (MA) indicator is trading at $88.51.

High volatility is a hint that the future is likely to be rather positive. The Bollinger bands display the lower band at $83, which represents the biggest support for LTC, and the upper band at $101, which represents resistance for LTC. There is a fierce battle between the bullish and bearish sides, as the Relative Strength Index (RSI) is hovering close to the index 48 value and the curve is practically horizontal.
Litecoin price analysis: Recent developments and further technical indications
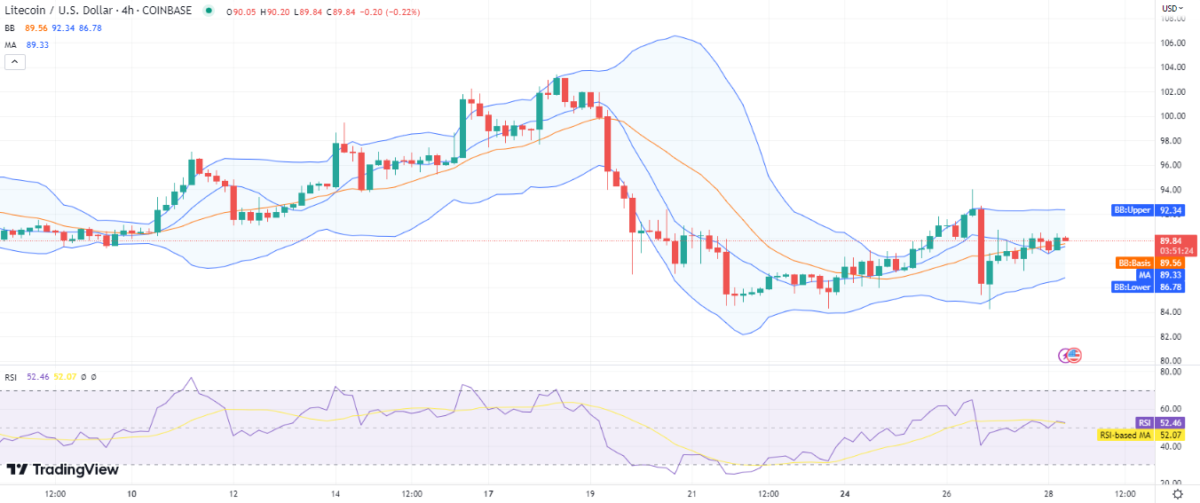
The 4-hour Litecoin price analysis is also showing a small increase in price levels today. The bullish momentum has been intact as the hourly trend line is still moving in an upward direction, and the price has gradually increased. A slow correction is also underway currently, as the coin is trading at $89.84 at the moment.

The moving average, on the other hand, is also below the SMA 50 curve and is $89.33. The volatility is gradually decreasing. The Bollinger’s bands are showing the following values; the upper band is present at $92, while the lower band is present at $86 while showing slow convergence. The RSI indicator is currently trading at index 52, which is in the upper half of the neutral zone and indicates selling activity, therefore, the score has slightly decreased.
Litecoin price analysis conclusion
The 1-day and 4-hour Litecoin price analysis suggests a little rise in price levels. today. The price has moved upward to $89.84 after bulls maintained their lead. The price could rise to the $90 range under the influence of the bulls. The price could return to the $88 level, though, if support withdraws.


