The price is moving upwards once again in the latest Litecoin price analysis as the bullish momentum returned to the market today. The price decreased in the past week tremendously, with a few flash crashes observed on 15 and 18 September 2022, which deteriorated the coin value extremely, and even yesterday, it experienced a downfall as the bears were ruling the market. The price dropped down to $51.02 before finding support, but bulls have made a significant return today, and the price started increasing and has reached $52.37; it is expected that it will increase further in the coming hours as well as the bulls are trying to evade the way for the lead after a long gap.
LTC/USD 1-day price chart: LTC finds support after the recent turnover
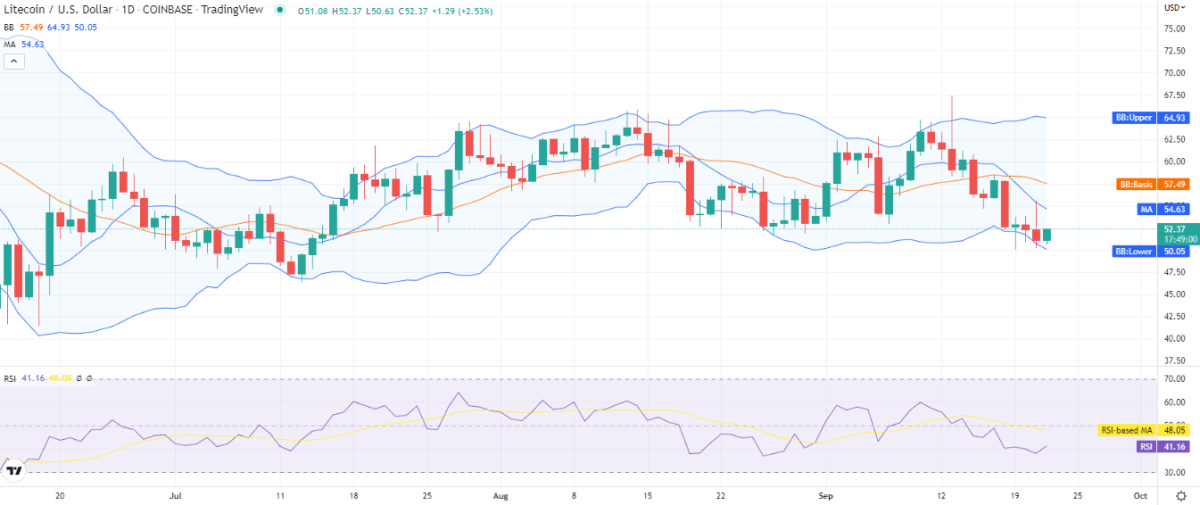
The 1-day Litecoin price analysis is showing signs of bullish activity as the price has increased considerably during the day after taking a dip. The past week has been quite unfavorable for the bulls, but right now, the bulls are in the leading position. The price has moved up to the $52.37 level as a result of the bullish activity. The moving average (MA) value is also standing high as it is resting on the $54.64 position, currently above the price level. The cryptocurrency is in a loss of 12.72 percent for the past week as the trend had been mainly bearish, but today’s trading volume has increased by 28 percent.

The volatility has increased today, which is why the Bollinger bands are expanding on the 1-day chart. Moreover, the Bollinger bands Indicator is showing a change in values as now the upper value is $64.93 representing the strongest resistance, and the lower value is $50.05 representing the support for LTC. The Relative Strength Index (RSI) score has increased as well as the indicator is trading at index 41 after the recent price upgrade.
Litecoin price analysis: Recent developments and further technical indications
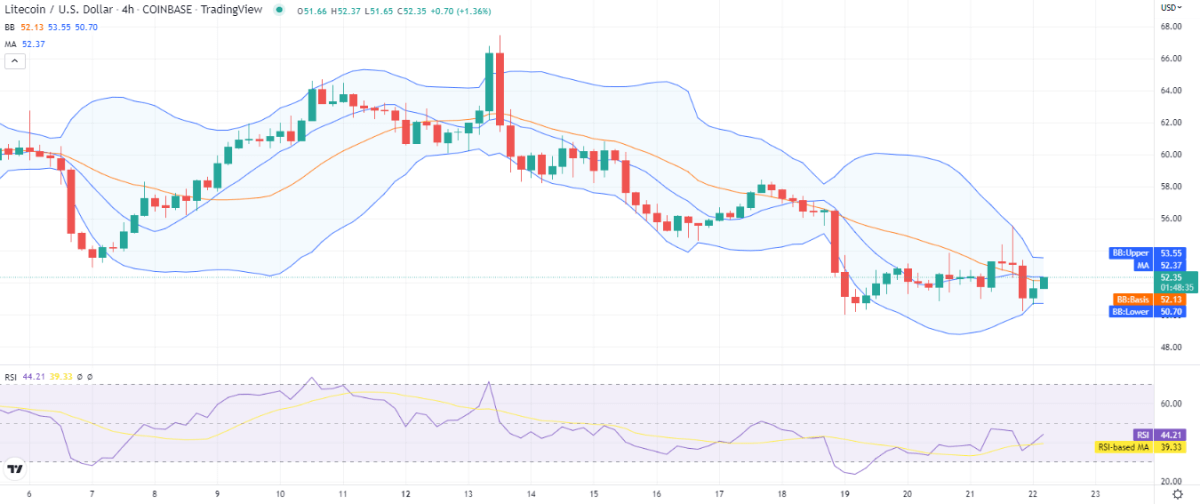
The 4-hour Litecoin price analysis indicates an increase in price after the return of the bullish candlesticks on the price chart. The bullish momentum has resulted in the price going up to its current value, which is $52.35. However, a strong bearish activity was also observed at the end of the previous trading session when the price corrected steeply, after which bulls took the lead and turned the trend in their own favor today. The moving average is still higher than the current price, i.e., $52.37, as the bulls have been largely in control today.

The volatility has been decreasing till yesterday, which is why the Bollinger bands average is now at $52.13. The upper and lower Bollinger bands values are as such; the upper value is standing at $53.55, representing the resistance, while the lower value is standing at $50.70, representing the support on an hourly basis. The RSI score has increased up to index 44 again after the buying activity seen during the last four hours.
Litecoin price analysis conclusion
The above 1-day and 4-hours Litecoin price analysis shows signs of bullish activity as the price has covered upward movement today. The trend as a whole is bullish mainly today, and yet resistance hasn’t been seen from the bearish side. The LTC/USD price is now resting at $52.37 and is expected to go up again. Although in the past week, the market has been quite unsupportive for the buyers, now the buying momentum is on the rise once again.
Disclaimer. The information provided is not trading advice. Cryptopolitan.com holds no liability for any investments made based on the information provided on this page. We strongly recommend independent research and/or consultation with a qualified professional before making any investment decisions.


