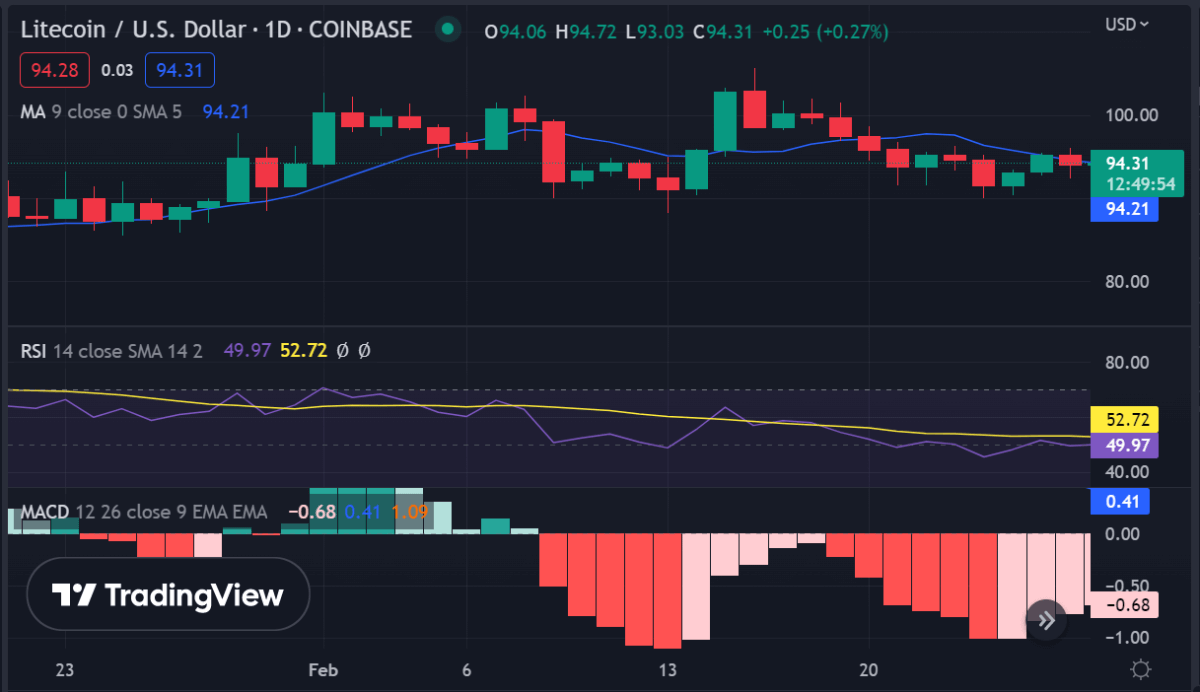
Litecoin price analysis shows LTC is stuck inside a tight range with the ongoing bearish sentiment and the lack of bullish momentum. Litecoin opened the daily chart trading at an intraday high of $95.89 and fell slightly below the $95.0 level. Litecoin is trading at $94.11 and is trading sideways in a tight range.
The price has dropped to the low of $92.82 in the last 24 hours, and it could break below this support level if bears remain in control. The Litecoin chart shows that a triangle pattern is forming with key resistance present at $95.00 and key support present at $90.00.
Litecoin price analysis on a 1-day price chart: LTC lacks bullish momentum
The 1-day chart of Litecoin price analysis shows LTC is bearish, with a strong bearish trend line showing resistance at $95.00 and support at $90.00. The MACD shows that the coin is trading in negative territory and that there is no bullish momentum present. The price of LTC is trading below the daily MA50 and MA200, indicating that it is bearish.

The RSI indicator has flattened and is currently residing at 49.90, indicating that the coin is trading in neutral territory. The Stochastic RSI, on the other side, is currently residing at 57.60, indicating that the coin is overbought and it could correct lower in the near term.
LTC’s price has sought support at the Fibonacci retracement level of 23.6%, which is currently at $93.00. If the price breaks below this level, it could move lower and seek support near the $90.00 mark. The resistance at the Fibonacci retracement level of 38.2%, which is currently at $96.00, could also act as resistance for the coin in the near term.
LTC/USD 4-hour chart analysis: Bulls attempt to protect the $90.00 support
The 4-hour chart of Litecoin price analysis shows that LTC is bearish and has been trading below the MA50, MA100, and MA200. The bulls have been pushing for a move higher but have been unable to break above the $95.00 resistance level. The Exponential Moving Average (EMA) shows that the coin is trading below all three levels, indicating that bears are in control.

The MACD line is exhibiting a bullish reversal as the oscillator is currently residing in positive territory. The RSI indicator is currently at 50.0 and is slowly climbing higher, indicating that the coin is in neutral territory.
If bulls can defend the $90.00 support level, Litecoin could move higher and attempt to break above the $95.00 resistance level. On the other hand, if bears remain in control, LTC could drop lower and test the $85.00 support level in the near term.
Litecoin price analysis conclusion
Litecoin price analysis shows that LTC is bearish and stuck inside a tight range, with key support at $90.00 and resistance at $95.00. The bulls have successfully defended the $90.00 support level, but they have been unable to break above the $95.00 resistance level. If bulls can break above this resistance, Litecoin could move higher and attempt to test the Fibonacci retracement levels of 50% and 61.8%. On the other hand, if bears remain in control, LTC could drop lower and test the $85.00 support level in the near term.


