Litecoin price analysis indicates that the LTC price has been bearish for the past 24 hours; however, the past week has seen some positive movement. There has been a significant decline in the price, which is now trading below the $89.18 level at the time of writing. While the price has been trying to maintain its current level and the market sentiment remains largely neutral, there is a possibility of a further decline in the price. The price of LTCUSD has decreased by almost 3.07% from the last substantial barrier at $88.76, challenging the significant present resistance at $93.00. The 24-hour trading volume for LTC has also decreased to $573 million with a market cap of $6.4 billion.
Litecoin price analysis 1-day chart: LTC/USD further declines below $89.18
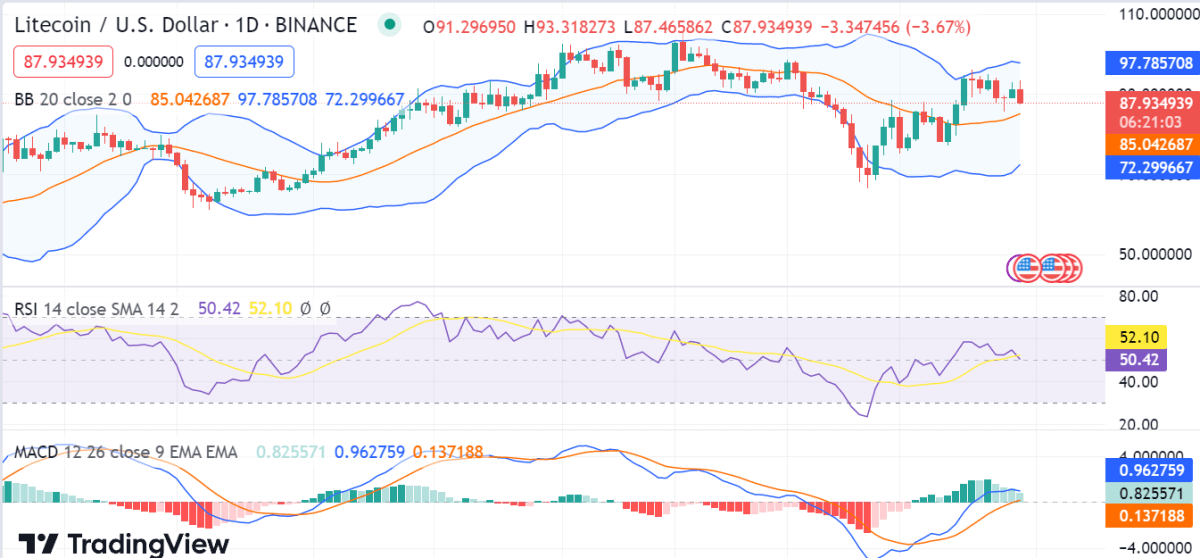
Looking at 24-hour Litecoin price analysis indicates that the price will likely remain range-bound between $89.18 and $89.15 in the short term, with a bearish bias. The support for the coin is present at the $88.76 level, which might hinder further downside movement. However, if the bears remain in control, it could push the price lower toward the key support level of $88.76.

The technical indicators are also signaling bearishness as the LTC/USD pair has formed a descending triangle pattern, suggesting that the price is likely to break below the lower trendline. Moreover, the moving average convergence and divergence (MACD) also show a bearish crossover, which supports a bearish outlook. The RSI score is also moving downwards below the centerline of the neutral range and is right now present at an index of 50.42. The strongest resistance is represented by the upper Bollinger band’s value of $97.785; the strongest support is shown by the lower Bollinger band’s value of $72.2999.
LTC/USD 4-hour price chart: Latest development
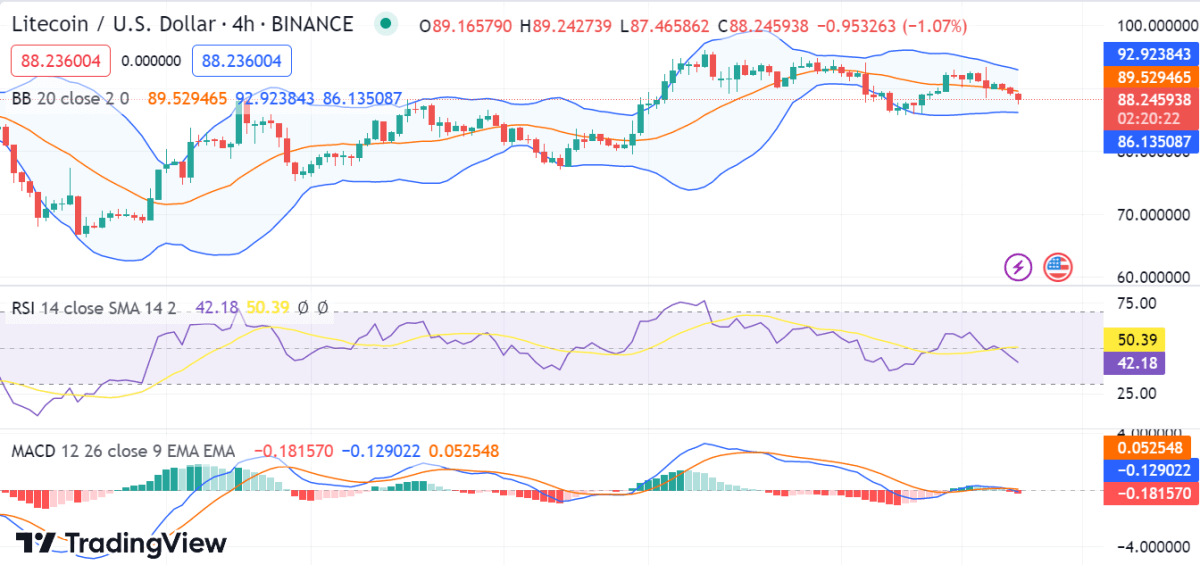
The 4-hour Litecoin price analysis shows that the price is trading below the $89.18 level, indicating a bearish trend in the near term. The bulls might try to push the price back above the resistance level, which is currently at $93.00, and attempt a recovery; if they fail, then further losses could be seen in the coming days.

The volatility is increasing, which means that the bearish wave is likely to expand in the upcoming days. Regarding the upper and lower Bollinger bands’ indicators’ values, the upper band shows $92.923 figures, whereas the lower band shows an $86.135 value. The relative strength index (RSI) curve is trading at 42.18, indicating that the bears are in control of the market. Additionally MACD line is below the signal line signifying that the price is still bearish
Litecoin price analysis conclusion
In conclusion, Litecoin price analysis indicates that LTC has been bearish for the past 24 hours and is likely to remain below $89.18 in the short term, with a bearish bias. The technical indicators and chart patterns also suggest that the bears might stay in control for some So traders and investors should be cautious while making their trading decisions. It is also important to keep an eye on the news and developments related to LTC, as any positive updates could provide some upside potential for the token.


