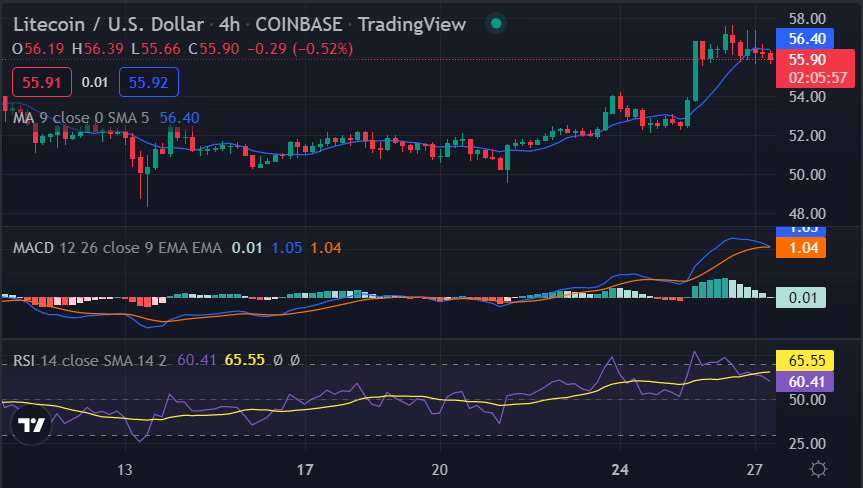
Litecoin price analysis reveals that LTC/USD is bearish today. The price has dropped by over 2.30 percent in the last 24 hours and is currently trading at $55.88. This latest leg down appears to have been caused by a general market sell-off, as most major cryptocurrencies are now in the red. Resistance for LTC/USD is present at $57.46, while the support is present at $55.86, and a further drop below this level could see LTC/USD head toward $55.50 in the near term.
The 24-hour trading volume for LTC/USD has declined sharply over the last 24 hours, which suggests that selling pressure is beginning to ease as it is currently sitting at just over $581 million. The market capitalization for LTC is now just over $3.99 billion, which puts it in 20th place in the crypto rankings.
LTC/USD 4-hour price analysis: Bearish trend continues
Litecoin price analysis shows that the bearish trend is still very much intact as the price has failed to make any significant headway over the last few hours. The 4-hour chart shows that LTC/USD has formed a bearish flag pattern, which is typically seen as a continuation signal. The price is currently trading just below the flag resistance at $57.46 which is a bearish sign.

The RSI indicator is currently showing signs of bearish divergence as it has failed to make any higher highs while the price has made higher highs. This suggests that the current rally may be running out of steam and that a move to the downside could be on the cards in the near term. The MACD indicator is currently in bearish territory, however, it is beginning to flatten out which suggests that momentum may be starting to turn in favor of the bulls. The LTC/USD is trading below the moving average indicator, which is a bearish sign.
Litecoin price analysis for 1 day: LTC/USD suffers devaluation at $55.88
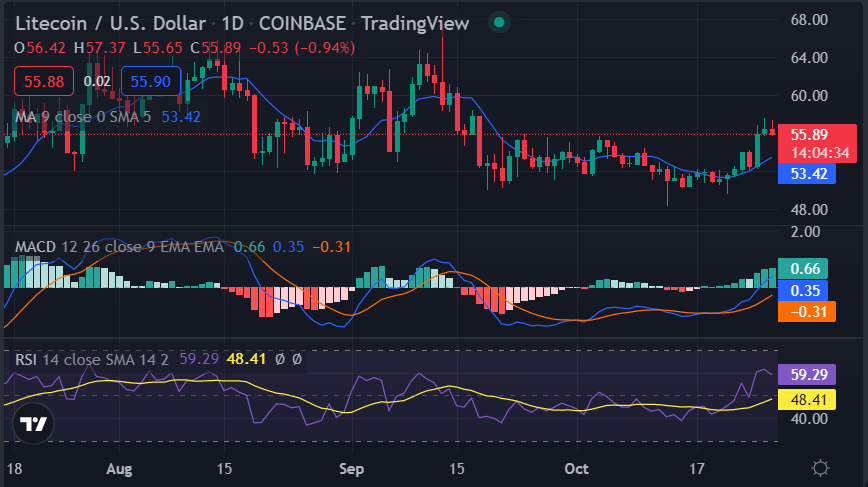
Litecoin price analysis is bearish today with LTC/USD losing tremendous value at $55.88. The last 24 hours have been tough for LTC as the price has dropped below the $55 mark. The bulls tried to uplift the price yesterday, but bears have successfully been able to tackle their momentum and have once again secured their winning position.

The moving average (MA) on a 1-day chart is lower than the current trading price, which indicates that the market is currently in a bearish mood. Also, the candlesticks are closing below the MA, which further validates the bearishness in the market. The MACD shows a bearish crossover, which supports the selling pressure in LTC while the RSI is at 48.41 and is moving towards the oversold region, which indicates that the selling pressure could continue in the market.
Litecoin price analysis conclusion
Litecoin price analysis reveals that LTC/USD is bearish today as the price has dropped sharply to $55.88. The market looks set to continue its downward trend in the near term as selling pressure appears to be easing. However, if the bulls can muster some strength, a move back above $57.46 looks possible.
Disclaimer. The information provided is not trading advice. Cryptopolitan.com holds no liability for any investments made based on the information provided on this page. We strongly recommend independent research and/or consultation with a qualified professional before making any investment decisions.


