Litecoin price analysis shows a bullish trend as prices move to reclaim the $66.37 level, However, the bulls may encounter selling pressure at this level. If they do, a retracement to around $64.90 could occur. Litecoin prices have seen a steady increase over the past hours as buyers return to the market. Prices reached a low of $64.90 on the previous day, and have since climbed back up to $66.37.
The price of LTC has seen some strong buying pressure as of late and looks poised to continue its upward momentum in the medium term. The market volatility has seen prices fluctuate between $64 and $66 over the past few days. Traders should keep an eye on the $47.13 resistance level as a breakout above this level could see prices move higher in the near term.
Litecoin price analysis shows trading volume has been on the rise in recent days as it is currently sitting at $308,493,057, while the market cap is at $4,777,811,662.
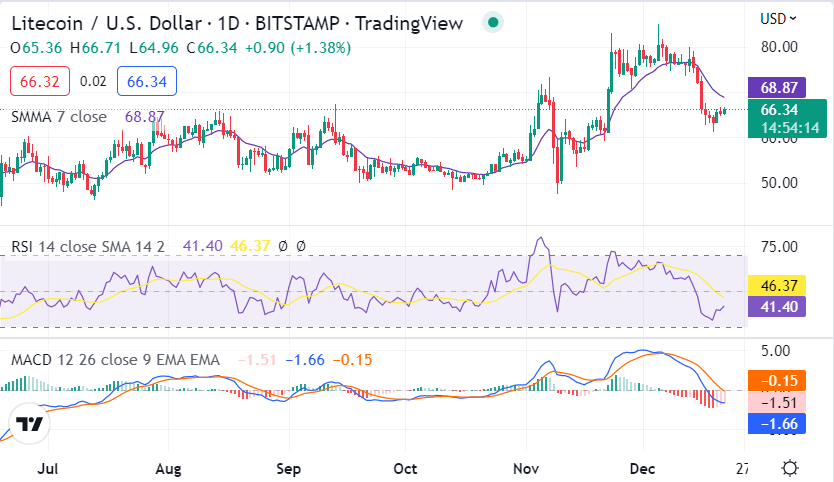
Litecoin price analysis on a 1-day price chart: Bullish trend looks to break above the $66.38 resistance
Litecoin prices analysis on a 1-day price chart confirms the firm bullish trend in the market as LTC prices have recorded a significant rise over the last 24 hours. The buyers have been consistent as the buying pressure looks to break above the $66.38 resistance level. The LTC/USD has gained 4.68% in the last 24 hours and could potentially continue upwards.

The moving averages are all sloping upwards, with the 50-day MA standing at $66.34 and the 200-day MA sitting at $68.87, indicating a bullish trend in the market. The SMA (Simple Moving Average) is currently sitting at $63.97, confirming the bullish trend in the market. The RSI indicator is currently at 46.37 and is slowly rising, which shows that the bulls are in control of the market. The MACD histogram is also in the green zone, confirming the bullish sentiment.
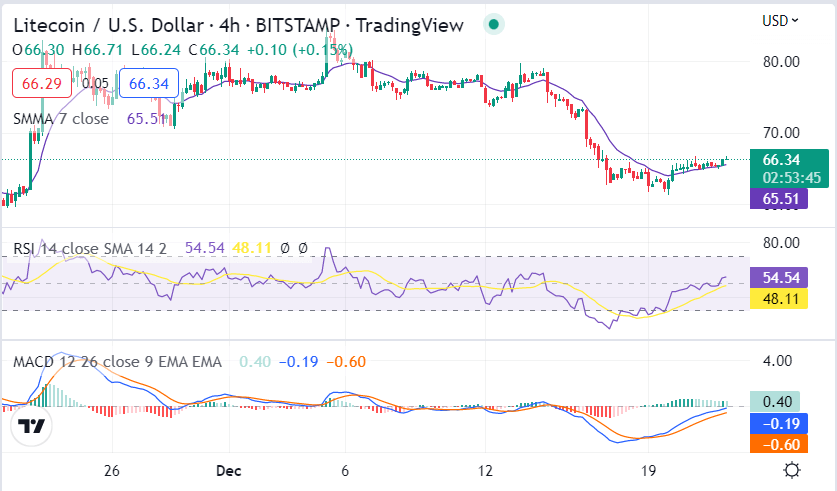
Litecoin price analysis on the 4-hour price chart: Further upside expected today
The 4-hour price chart for Litecoin shows that the bulls have been in control of the market as prices have risen steadily over the past 4 hours. The bulls have won the race after managing to break bearish pressure around the $65.50 level. The RSI indicator is currently at 48.11, indicating that further upside could be expected today as the buyers look to break above the $66.38 level of resistance.

The MACD shows that the buyers have the advantage over the sellers as it is currently in a bullish crossover, indicating further upside could be expected in the near term. The Smooth Moving Average (SMA) is currently at $65.51, confirming the bullish trend in the market. The MA indicator is currently at $65.91, indicating further upside could be expected today.
Litecoin price analysis conclusion
In conclusion, Litecoin price analysis shows that the bulls have been in control of the market over the past few days and could potentially push prices higher if they break above the $66.38 resistance level.


