The NEO price analysis highlights a favorable buying momentum, with the current price reaching $10.88. Over the past few hours, the bulls have generally enjoyed a positive market environment, despite some selling pressure being present. Notably, the coin has successfully surpassed the resistance level at $10.71, indicating a promising outlook. Looking ahead, there is a strong likelihood of the bulls maintaining control of the cryptocurrency market in the upcoming weeks.
NEO/USD 1-day price chart: Highly positive market sentiment is reflected on the chart
For the NEO price analysis, if we look at the daily candlestick chart, it shows cryptocurrency values are going in favor of buyers, with the price rising to $10.88. The past two weeks have proved to be suitable for NEO price growth, with buyers flooding the market. The moving average in the daily chart is showing us the value at $10.04; meanwhile, the volatility is gradually increasing for the bulls as the coin has already gained more than a marvelous 10 percent value today.

The average of Bollinger bands has reached the figure of $9.65, with its upper and lower strands resting at $10.71 and $8.59, respectively, as they now represent the nearest and strongest supports. The Relative Strength Index (RSI) value is 59, which is a good benchmark for NEO market value as the buying process is progressing.
NEO price analysis: Recent developments and further technical indications
The latest NEO price analysis shows the dominance of green candlesticks with slight resistance from the red ones. Yet, the latest chart continues to show bullish momentum, with the price approaching $10.88 for the second day today. The average of Bollinger bands is set at $10.07 at the time of writing.
The short-term trend line is moving upward, and the SMA 20 curve is also moving upward, indicating a bullish uphold. The moving average indicator is displaying a value of $10.38, which is the highest value achieved in the past 24 hours.
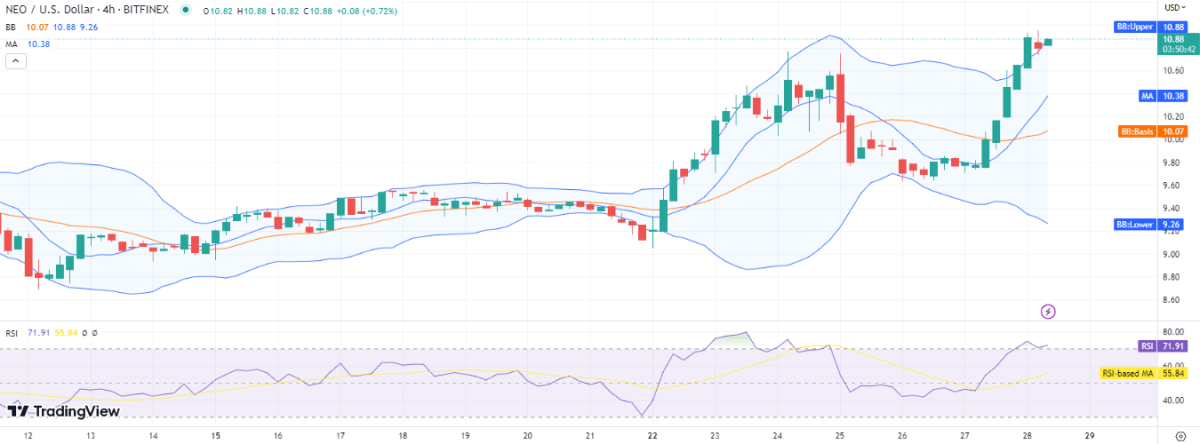
The RSI score is right now 71, which is evidently a higher score, hinting at the fact that the coin is currently overvalued. The indicator can give a sell call at any time. The volatility seems to be increasing as the Bollinger bands are expanding in favor of the higher price oscillations and predicting high price fluctuations in the coming hours.
NEO price analysis Conclusion
From the given NEO price analysis, we can say that the bulls seem to be taking over the cryptocurrency with a steep rise in price. This rise may take the current price levels higher and reach a new high above the $10.90 resistance. The RSI score as detected from the hourly chart is 71, which has crossed the overbought threshold set for the coin value.
This is affirming the upcoming rise in the price if the support level continues to increase as well. The resistance level at $11.29 can be challenged if the buying momentum remains persistent.