Neo price analysis has been quite bearish today, in line with the overall sentiments of the cryptocurrency market. The day itself did not start on a positive note for NEO as the price closed at $8.5 yesterday after dipping from $9.0 two days earlier.

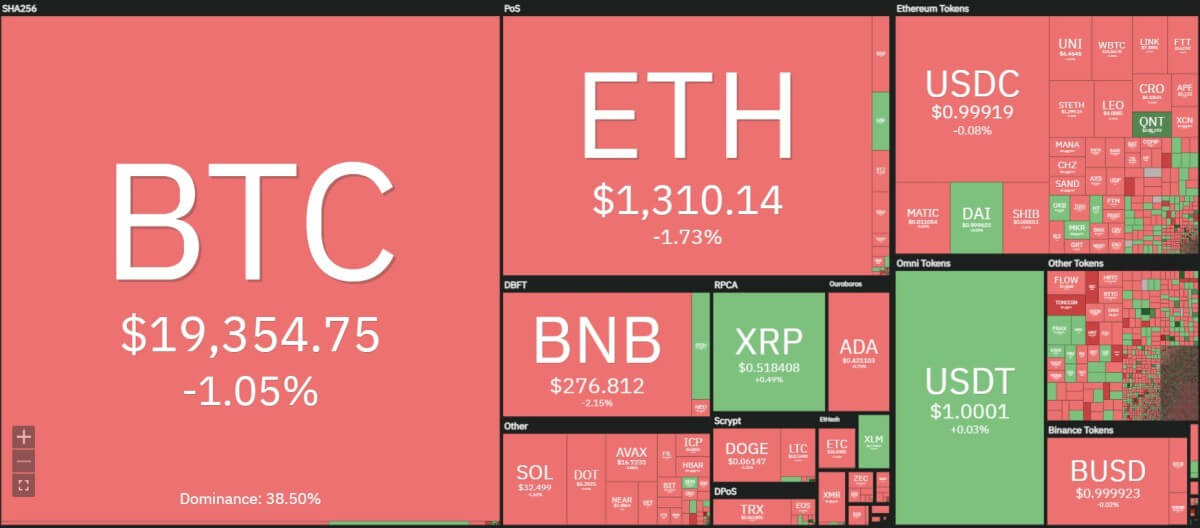
As the crypto heat map shows, Ethereum’s price has reduced by 1.73 percent, whereas Bitcoin has reduced by 1.05 percent. While these figures are insignificant, the market still lacks any major bullish sentiment that can lead to recovery.

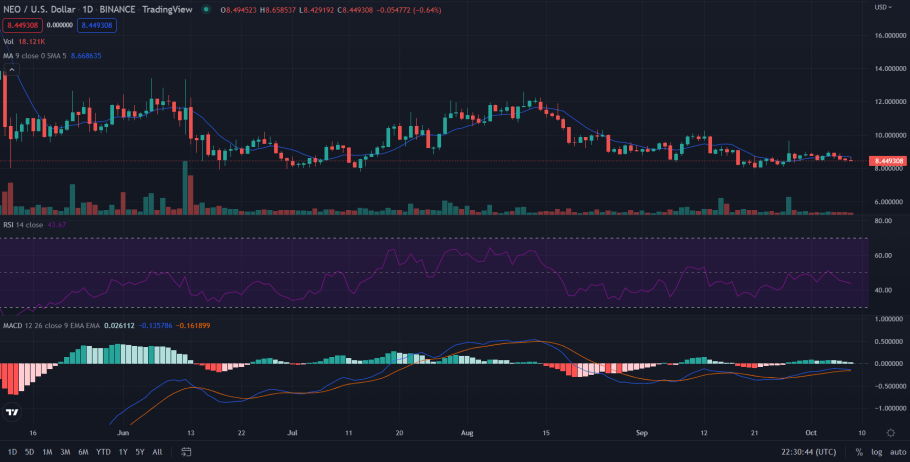
At the same time, the 1-day Neo price analysis further gives us some negative indications. We can see on the MACD indicator that the green histograms are slowly losing their strength. A crossover in the MACD lines is also impeding, which might give the bearish momentum another push. So, Neo is expected to dip further in the next two days. Nevertheless, the RSI is still somewhat balanced. So, Neo is not under any temporary rally. Instead, there is not much bullish momentum currently in the market.
Neo 24-hour price movement

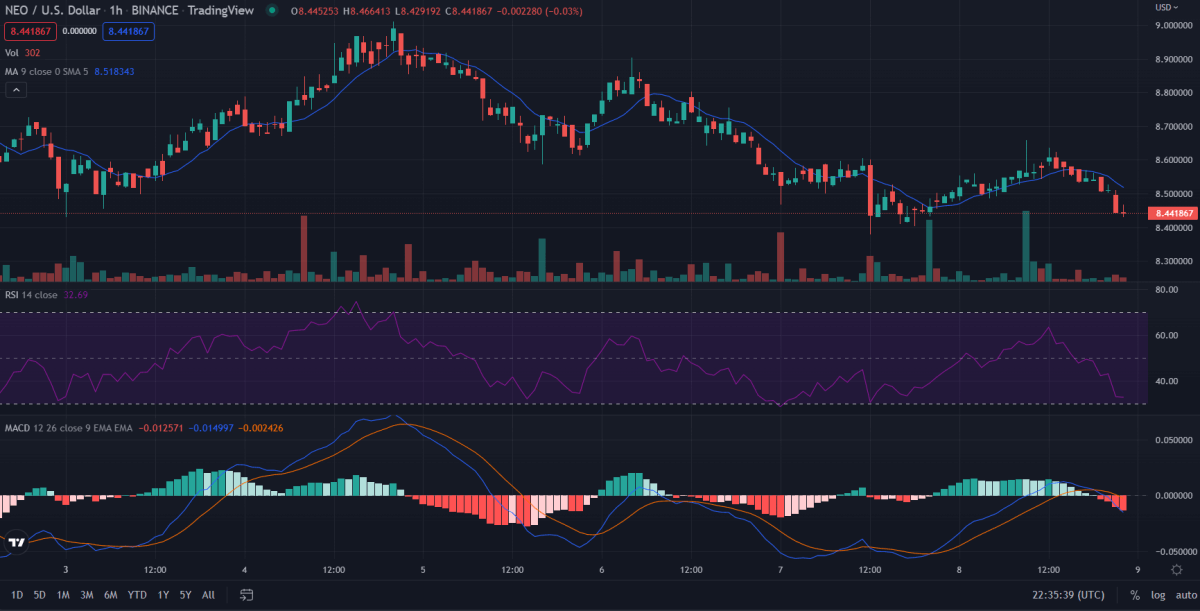
The 1-hour NEO price analysis gives us similar indications as the daily chart. In the last 24 hours, the price of Neo has reached a 24-hour high of $8.65 and then dipped back to the $8.4 mark. Currently, Neo is hovering around the support line, which is around $8.40.
As the MACD indicator suggests, the downward momentum constantly increases. It looks like Neo is gearing up to test the $8.4 support line. The MACD lines have already undergone a crossover, suggesting a major momentum shift. The RSI shows that the market is still somewhat balanced, although leaning towards the oversold side.
The overall market cap of Neo has decreased by 0.35 percent in the last 24 hours, while its trading volume has gone up by 17.43 percent. In the next 24 hours, Neo will try to test the $8.40 support, and if broken, a major dip might be expected.
4-hour Neo price analysis: Preparing for the downside?

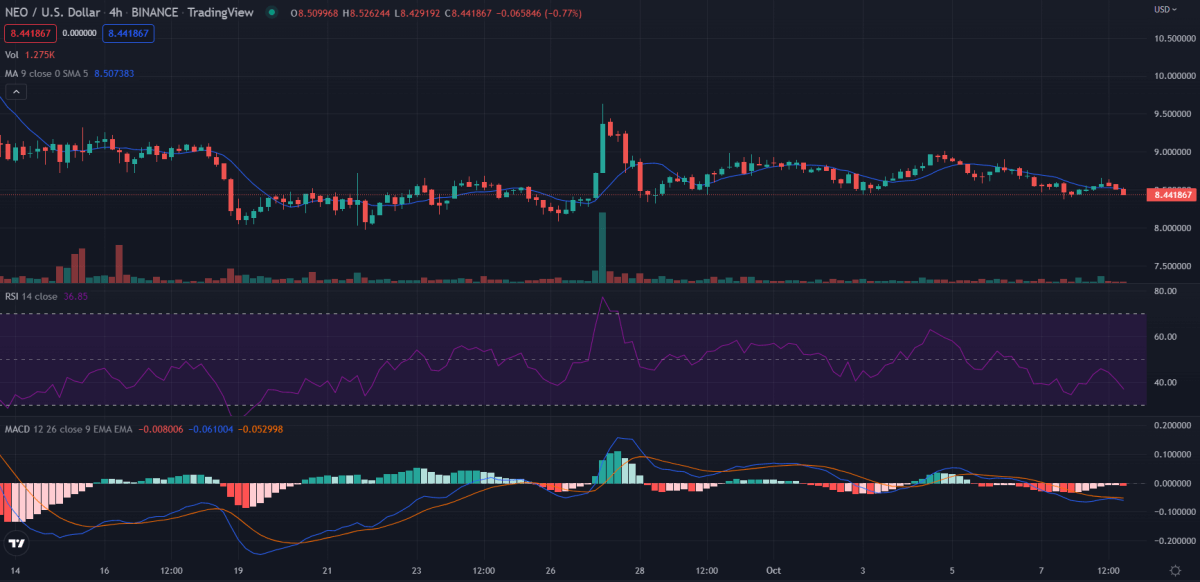
Neo set a major resistance line around the $9.6 mark on the 27th of September, 2022. Since then, it has not tested that line. Instead, Neo has traded mostly in the range and is currently gearing up to retest the $8.40 support line.
However, as the MACD indicator suggests, Neo is currently very bearish. There are no indications of bullish momentum building up. Instead, the bearish momentum seems to be getting stronger and stronger. So, it is possible that Neo might break the support level and dip slightly lower before recovering in the next 24 hours.
Neo price analysis: Conclusion
Neo is quite bearish today and is about to test the $8.40 support line again. Since the bearish momentum is strong, it might break the support before recovering again. However, like always, the cryptocurrency bear market can sometimes be uncertain.
Disclaimer. The information provided is not trading advice. Cryptopolitan.com holds no liability for any investments made based on the information provided on this page. We strongly recommend independent research and/or consultation with a qualified professional before making any investment decisions.


