The current outlook for Polkadot price analysis remains bearish as the market witnessed another significant decline today. The price levels have plunged to $5.24, displaying a consistent downward trend since yesterday, when bears seized control and shifted the momentum in their favor. Today, the bears have continued to dominate, extending the ongoing downtrend. There are anticipations of further price drops in the forthcoming hours, adding to the overall bearish sentiment.
DOT/USD 1-day price chart: DOT’s loss deepens by 1.50 percent amid ongoing bearish pressure
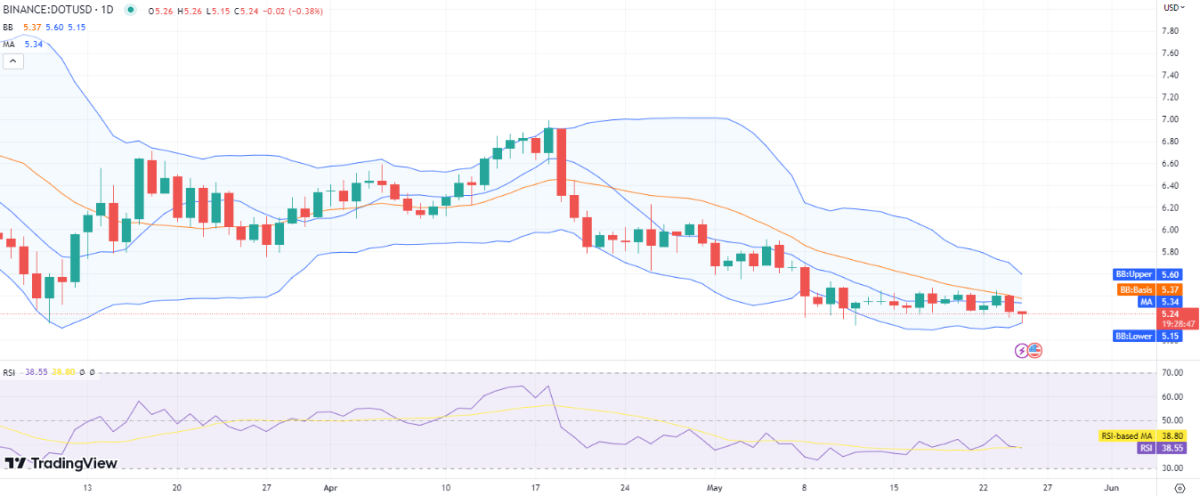
The 1-day Polkadot price analysis indicates a resumption of the downtrend, with bears regaining their momentum following a temporary reprieve. The cryptocurrency’s value has once again started to decline, reaching a low of $5.24 and experiencing a loss of over 1.50 percent. This downward trend aligns with the previous week’s performance, where the coin witnessed a four percent decrease in value over the past seven days. However, there is a silver lining, as the trading volume has seen a notable increase of 20.60 percent. Additionally, Polkadot maintains a market dominance of 0.57 percent among other cryptocurrencies.

The current state of volatility in the cryptocurrency market is witnessing a decrease, as evident from the converging Bollinger bands. However, this reduction in volatility does not bode well for the future of the cryptocurrency. The upper limit of the volatility indicator is displaying more convergence, reaching the $5.60 level. This indicates potential resistance to the price of DOT. On the other hand, the lower limit of the Bollinger bands stands firmly at the $5.15 mark, indicating robust support for the cryptocurrency.
Examining the moving average (MA), it currently rests at $5.34, positioned above the current price level. This suggests a slightly bearish sentiment. As for the relative strength index (RSI), it is trading within the neutral range but has witnessed a decline, with a score of 38. This decrease in RSI signifies increased bearish pressure on the price of DOT.
Polkadot price analysis: Recent developments and further technical indications
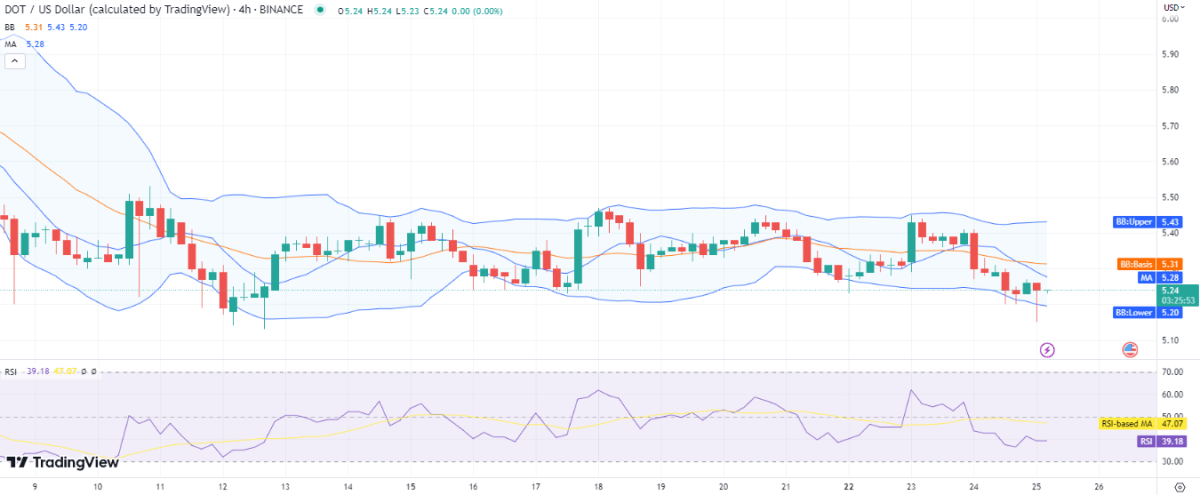
Analyzing the 4-hour Polkadot price analysis, it becomes evident that the bearish momentum continues to push the price further downward. Currently standing at $5.24, the price reflects the prevailing bearish trend throughout the day. However, there are also glimpses of bullish activity on the hourly chart, as bulls attempt to provide support and facilitate a price recovery. This positive development serves as an encouraging sign for buyers. Nevertheless, it is important to note that selling pressure persists within the market, posing a challenge to sustained upward movement.

In relation to the Bollinger band mean average, the moving average (MA) is positioned at a lower level of $5.28. Examining the 4-hour price chart, the upper Bollinger band registers at $5.43, while the lower Bollinger band is set at $5.20. These values delineate the price range within which fluctuations are expected. Meanwhile, the relative strength index (RSI) has witnessed a decline, currently hovering around 39 on the 4-hour chart. This places the indicator in the lower half of the neutral zone, indicating a notable bearish opposition.
Polkadot price analysis conclusion
The Polkadot price analysis indicates the persistence of bearish pressure that has been evident since yesterday, leading to a decline in price levels, now reaching $5.24. While the bearish trend continues to exert its influence, there is a glimmer of hope. The presence of bulls in the market suggests the possibility of a price recovery, provided the market conditions support such a turnaround.


