Polkadot price analysis shows a bearish trend as the price of DOT struggles to break out of the current downtrend. The SOL/USD pair is trading below the significant level of $6.30 and has recently been rejected at the resistance barrier of $6.39. The bulls were active previously, and an uptrend was following for the past two days; the crypto pair gained significant value during this time, but today bears have taken the lead again.
The DOT/USD is currently trading at $6.19, with a loss of 1.53 percent in the last 24 hours. The crypto pair is currently supported at $5.96, which was previously low. The crypto pair is struggling to break the downtrend, and if the bulls are able to gain some momentum, the price levels can surge upwards.
Polkadot price analysis 1-day price chart: Bears made a comeback
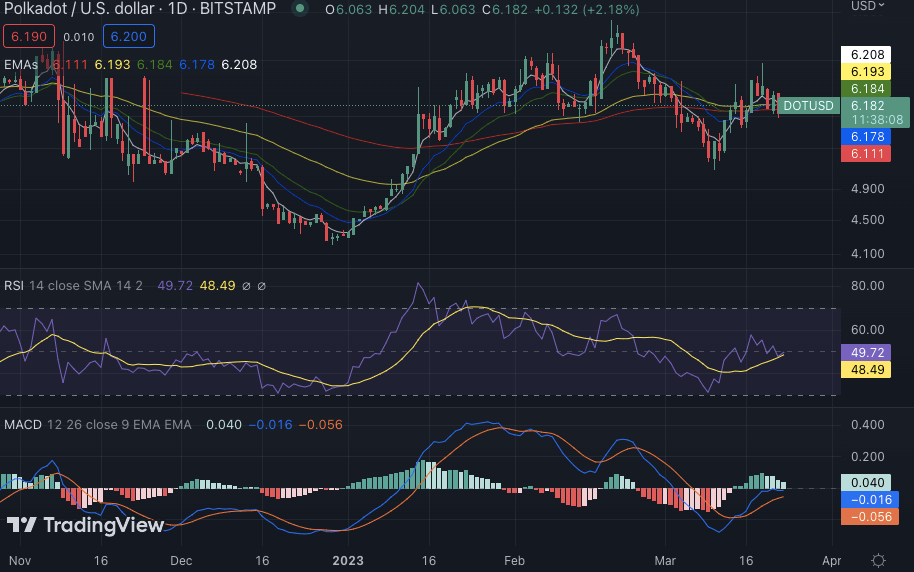
The 1-day price chart for Polkadot price analysis is going in favor of the bears once again, as they have regained their momentum after a short period. The price value has been pulled down, as today it has reached the value of $6.19. As the coin rallied quite high yesterday, selling pressure is expected at higher levels.
The trading volume of the coin has also seen a decrease, and it is currently trading at $231 million. The 24-hour market cap of DOT is recorded at $7.23 million, with a loss of 1.44 percent in the last 24 hours.

The technical indicators for Polkadot price analysis are bearish right now, as the MACD is currently lying below the midline, and the signal line is also trending downwards. The EMA 10 and 20 lines have converged and are heading downwards, which confirms that a downtrend is prevailing in the market. The RSI is trading at 49.72, which confirms that buying pressure is low and the bears have the upper hand.
Polkadot price analysis: Latest developments and further technical indications
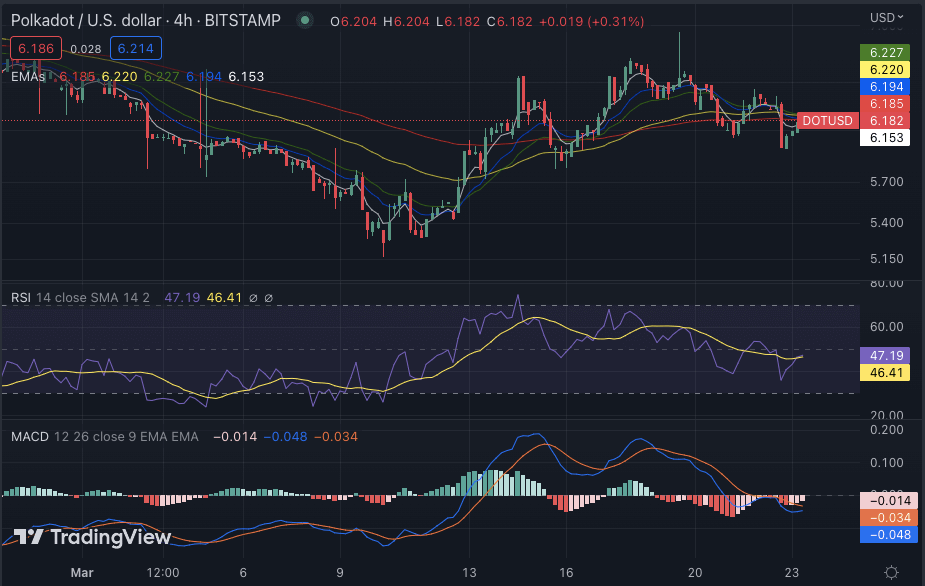
The 4-hour Polkadot price analysis indicates that the bearish momentum has resulted in a momentary decline in the price value. The price dropped to $6.19 during the first four hours of today’s trading session as bears took control of the market. The crypto pair is struggling to break out of the downtrend, and it may take some time for a trend reversal to occur.

The 4-hour Stochastic RSI oscillator has dropped below its midline and is trending downwards, which confirms that selling pressure is high. The Moving average convergences and divergences are also pointing toward a bearish trend as EMA 19, and 50 lines have converged and are trending downwards. The exponential moving average of 10 and 20 indicates that the pair is facing bearish pressure, as both lines are moving downwards.
Polkadot price analysis conclusion
The Polkadot price analysis suggests the price levels have lowered to $6.19 as more sellers have entered the market as compared to buyers. If the bulls are able to find a chance to improve the price values, then there is a possibility that the price will continue its journey to cross the $6.39 resistance level. The current technical indicators are pointing towards a bearish trend, and the bulls will have to make an effort for a price surge in the market.


