The Polkadot price analysis is bullish for today as the bulls have continued their lead for the last 24 hours. The coin price has recovered to $6.19 due to continuous bullish efforts the DOT/USD pair faces resistance at the $6.20 level. A break above this resistance level would confirm the bullish trend and open up the possibility for further gains toward the $6.21 and $6.22 levels.
On the downside, support for the DOT/USD pair is seen at the $5.86 level. A break below this level could see the pair retrace toward the $5.50 support level. The Polkadot price is currently trading in a bullish trend as the bulls push the price higher. The 24-hour trading volume is $193 million, and the market capitalization is $7.00 billion.
Polkadot price analysis 1-day price chart: DOT/USD trades at $6.19 after a bullish run
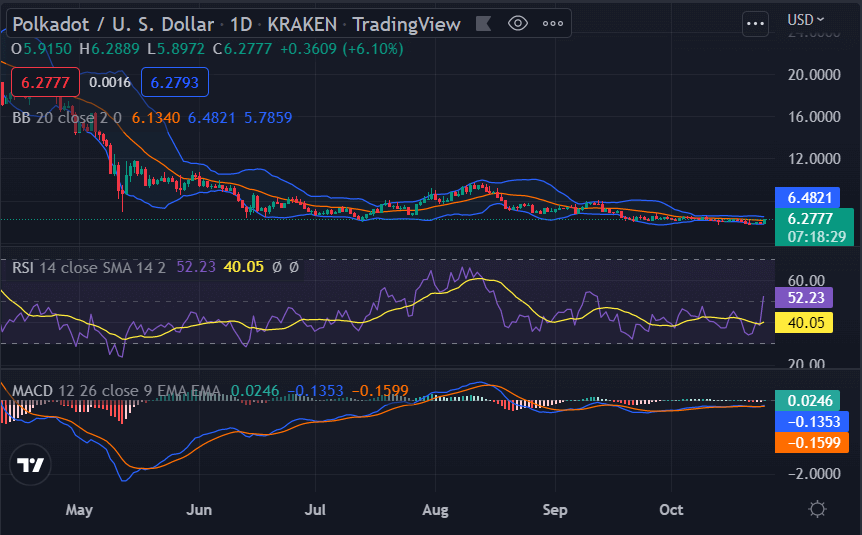
The one-day Polkadot price analysis gives encouraging news for cryptocurrency buyers, as the price has increased significantly during the day. The coin is currently trading at $6.19 at the time of writing, and chances are there for further increases in price levels if bulls show consistency. The currency has already gained 5.86 percent over today, which is a big achievement for the bulls. The MACD line is above the signal line, which indicates that the price is rising.

The Bollinger band’s upper value is 6.27 representing the resistance for DOT, whereas the lower value is $5.86 representing the strongest support for DOT price. The Relative Strength Index (RSI) graph shows a very slight upward curve as more buying activity is taking place in the market, and the RSI level has reached index 40.05 near the centerline of the neutral zone.
Polkadot price analysis: Recent developments and further technical indications
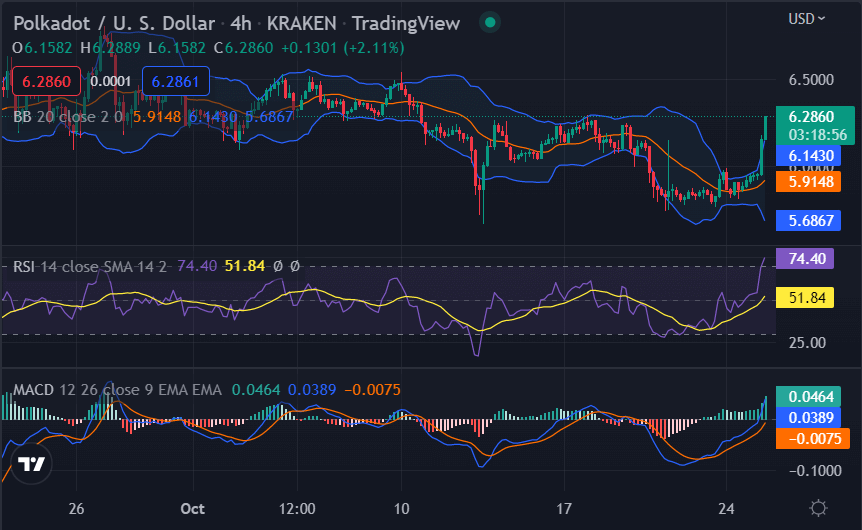
The hourly Polkadot price analysis is also in support of the buyers today as the price has constantly been increasing. The green candlesticks are marking a rise in price over the past four hours. The price has reached near the upper limit of the volatility indicator as the buyers currently control the market trends. Right now, the cryptocurrency value is found trading at $6.19 after gaining significant value.

The MACD indicator is also in the bullish zone as the market looks to resume its uptrend. The upper band of the Bollinger bands indicator is present at the $6.21 mark, and the price is traveling towards the upper band, whereas the lower band is present at the $5.91mark. The RSI graph shows horizontal movement as the indicator is trading at index 51.84, hinting at selling pressure building up at the current price level.
Polkadot price analysis conclusion
The price is headed up once again, as it has been confirmed from the one-day and four-hour Polkadot price analysis. The price has followed an upward movement today because of the bullish trend dominating the market. As bulls have been in the driving seat for the past 24 hours, a correction may appear in the coming hours if bears show any activity. But if the buying momentum continues, then DOT may continue upside above $6.20.


