Polkadot price analysis for today shows a bullish trend, as the DOT/USD pair has risen to $6.72. The strongest resistance for DOT is currently at $6.77, but if this level is surpassed, it could potentially lead to further gains. On the other hand, support for Polkadot can be found at $6.36.
The DOT/USD has gained nearly 8% in the past 24 hours as the DOT market continues to see strong bullish momentum. The 24 trading volume has increased to $3.4 billion, indicating a strong level of interest in the cryptocurrency, with a market cap of $6.1 billion.
DOT/USD 1-day price chart: Bulls take the price further high
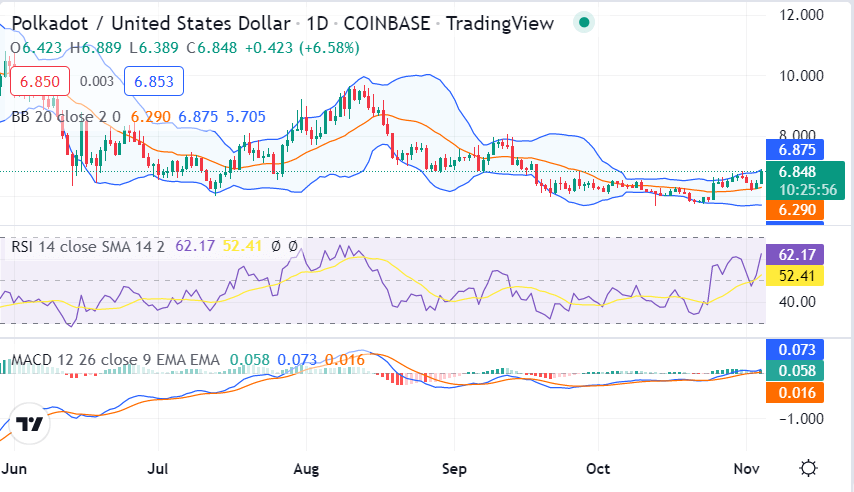
The 1-day price chart for Polkadot price analysis shows an increase in price as bulls are still in dominating position. The market sentiment is positive towards DOT/USD pair, but some sort of selling pressure also exists at the current price level as at one instance today, the price went significantly down but was soon rescued by DOT bulls.

The Volatility is increasing again as Polkadot has been showing a volatile character for the past few days. The Bollinger bands started expanding, indicating a possible breakout in either direction. The Relative Strength Index (RSI) is currently at 52.41, showing that the market is neither overbought nor oversold. This suggests that there is still room for growth. The MACD oscillator indicator shows strong bullish signs, as well as the histogram moving upwards.
Polkadot price analysis: Recent developments and further technical indications
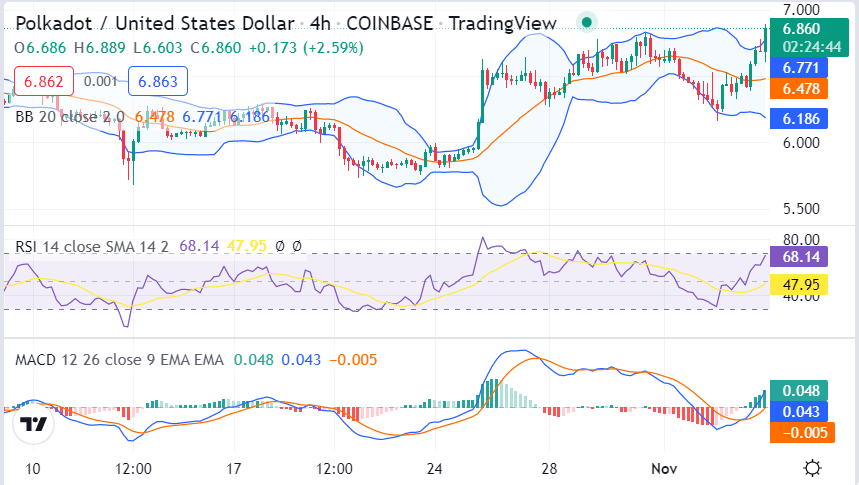
The 4-hour price chart for Polkadot price analysis further reconfirms the ongoing bullish momentum as the price continues to go towards further heights. Bulls have successfully formed a short-term upwards-trending price line. A robust buying activity seems to be going on at the time of writing as the price is going past the $6.70 mark.

The Volatility remains high as the Bollinger bands continue to expand. The upper band is currently at $6.87, while the lower band is at $6.48. The RSI also remains in bullish territory, currently at 47.95. The MACD indicator shows a strong bullish crossover as the signal line moves above the MACD line.
Polkadot price analysis conclusion
Polkadot price analysis suggests the short-term outlook is bullish, with the price potentially breaking past the $6.77 resistance level in the coming days. The bulls seem to be in control, with strong buying activity and technical indicators all showing positive signals.
Disclaimer. The information provided is not trading advice. Cryptopolitan.com holds no liability for any investments made based on the information provided on this page. We strongly recommend independent research and/or consultation with a qualified professional before making any investment decisions.


