Polkadot price analysis is giving us strong bullish signals for the day. The bullish tide has been very strong as the price levels are rising at a frequent and regular rate. The price is present at the $6.39 level which is quite an accomplishment for the buyers. Further advancement from the bullish side is expected as the support is stabilized at the $6.12 level for now, which was the previous low price.
The bulls are in full control of the market, and a potential buying opportunity is currently on offer as the price continues to remain close to $6.44. The target for the buyers should be set at around $7. However, there can be some resistance present near this level which may cause a drop in prices from here.
DOT/USD 1-day price chart: Bulls overcome bears after being grounded for a while
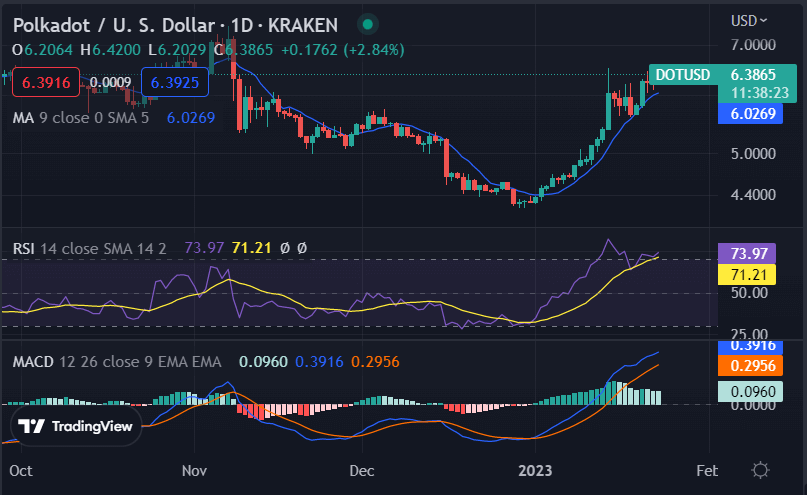
The given one-day price chart for Polkadot price analysis is depicting cryptocurrency value as going in a bullish direction. The day has been quite supportive for the buyers as more and more green candlesticks are securing their positions on the price chart. The price levels are rising slowly and right now the price value has reached the $6.39 level which is an appreciable recovery. The bulls are progressing at a very slow pace as the moving average (MA) is still ahead of the current price i.e. at $6.02.

The MACD is also in the favor of the buyers as it is showing a positive crossover which indicates that there can be further advancement from here. As per the RSI, it is at 71.21 and progressing in an upward direction. This implies that cryptocurrency price has a lot of upside potential to offer and we can confidently expect some price hikes from hereon.
Polkadot price analysis: Bullish pressure results in a higher price near $6.39
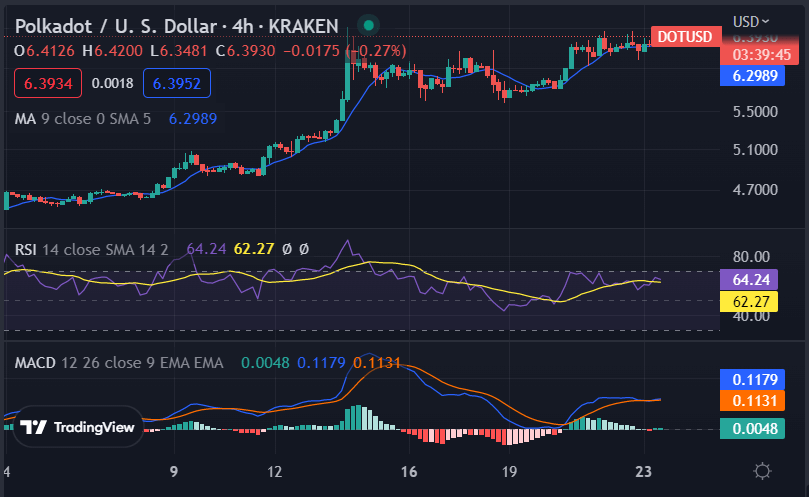
The 4 hours for Polkadot price analysis is telling us that the bars have been quite high for the bulls today. The circumstances have been highly favorable for the bulls for the past several hours as the bulls are dedicated to crossing the $6.44 resistance. The Polkadot price analysis is up by 3.4% on the day and currently trading at $6.39. The moving average is increasing with the current price and is at $6.29.

The buyers are quite confident about their position in the market as the MACD is showing a major bullish crossover, with the red line below the blue line. The RSI is also moving close to the overbought region which means that there can be some corrections from the bullish side soon. The 20-SMA is still ahead of the present price, but the last few hours have been quite supportive for the buyers, while the 50-SMA is currently at $6.19 which is also a bullish indicator for the buyers.
Polkadot price analysis conclusion
Overall, the Polkadot price analysis is quite positive and all the indicators show strong potential for growth in the near future. We can expect some major price hikes if bulls continue to dominate and breach major resistances. However, buyers should maintain a watchful eye on the market and keep a check on the rising bearish pressure.


