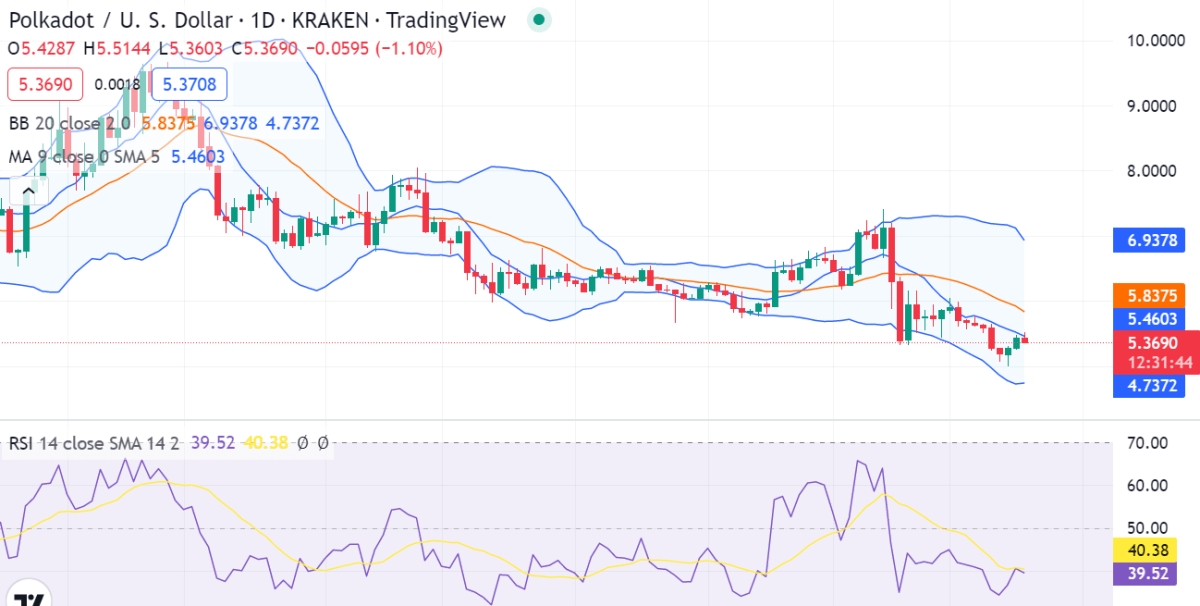
Polkadot price analysis confirms an increasing trend for cryptocurrency today as the coin value has increased tremendously, reaching above $5.45, the resistance level for DOT/USD is at $5.51 and the support level is at $5.33. The bullish momentum we are seeing in this market will likely continue as more investors and traders enter the space and push up prices. The coin’s market capitalization stands at $6,222,258,772 and has a 24-hour trading volume of $$228,680,011.
DOT/USD 1-day price analysis: Bullish momentum continues
The 24-hour chart for Polkadot price analysis reveals a strong bullish trend for today as the coin value has significantly improved. The effort from the buyers’ side remained commendable and persistent throughout the last 24 hours. And now, the circumstances are again in support of the bulls as the price covered an upward movement up to a $5.45 higher position gaining a 1.07%.

The volatility in the one-day price chart is still at the lowest level and it is a sign of a very stable uptrend. To determine the support levels, we can look at the upper Bollinger bands at $10.014 and the lower ones at $6.640.The relative strength index (RSI)is currently at 40.49 which indicates that the market is oversold. The Moving Average is currently at $5.467 which is a good sign for the buyers.
DOT/USD 4-hour price analysis: Recent updates
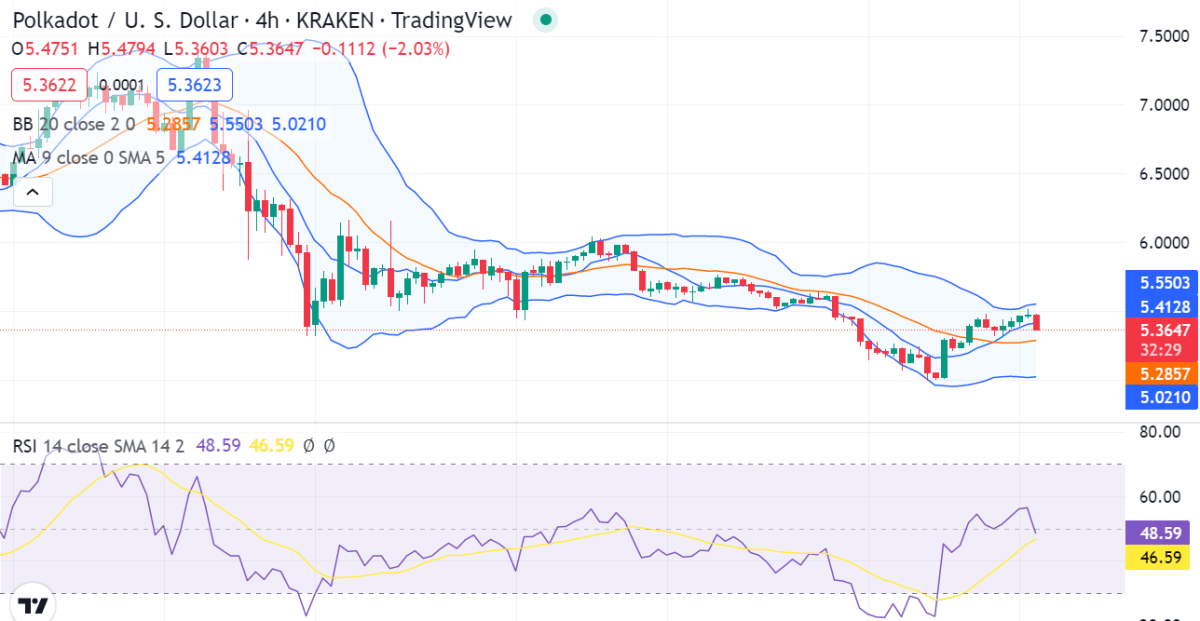
The hourly Polkadot price analysis favors cryptocurrency buyers as a strong rise in DOT/USD value was detected in the past few hours. The bulls have been dedicated to rewin their leading position in the market, and so far, their progress has been fascinating. The price experienced a rise to $5.45 in the last four hours because of the upturn as the bulls have been leading the price action for the past 4 hours in a row.

The Moving average at $5.418 is another good sign for the buyers. The RSI indicator stands at 46.79 and is indicating a bullish trend going forward. The Bollinger bands are also indicating a bullish trend as the upper band is at $5.85 and the lower Bollinger band is at $5.68, which means that the market has strong upward momentum in this range.
Polkadot price analysis conclusion
Polkadot price analysis reveals the bulls have been reigning high, as confirmed by the above one-day and four-hour price chart. An overpowering bullish wave dominated the market in the past 24 hours while bullish current is expected to continue in the upcoming hours.
Disclaimer. The information provided is not trading advice. Cryptopolitan.com holds no liability for any investments made based on the information provided on this page. We strongly recommend independent research and/or consultation with a qualified professional before making any investment decisions.


