Polkadot price analysis is going bullish today as the bulls continue to push DOT above $5.27. This has been a good sign for investors and traders alike as they are expecting the price to rise further. The bulls are targeting the level of $5.28 as the next resistance point, and if this is broken then more gains can be seen in the near future.
On the other hand, Polkadot price analysis reveals that the price is slowly moving in a bull direction. Currently, the price of DOT is sitting at $5.27 gaining more than 3.81% in the last 24 hours.
Although, the past few hours have been critical as the bearish momentum has been very strong, today the bulls are trying hard to lift the price level as per Polkadot price analysis.
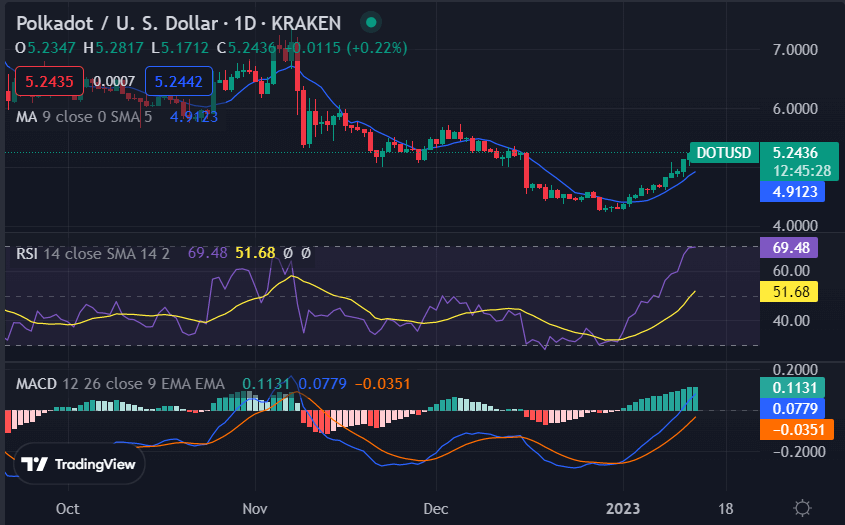
DOT/USD 1-day price chart: Bulls making a sluggish recovery, climbing past $5.28
The 1-day Polkadot price analysis chart shows that the cryptocurrency value has seen a slight recovery above the $5.28 resistance today. In the last few days, bearish momentum has caused a huge impact on the price value, as the momentum has been very intense.
Currently, the buyers are finding it difficult to push the price above $5.28, as there is strong resistance from the sellers at this point, making an increase in trading volume crucial. The 24-hour trading volume is at $195 million, making the price more volatile, While the market cap is at $6.077 Billion, up by 3.86%.

Today, the price levels are recovering to their former height at a slow pace, and there are some chances that they will reach the moving average (MA) level at $4.91 soon. The MACD is showing a bullish crossover, and the RSI is also in the positive zone, suggesting that more gains can be seen in the next few hours.
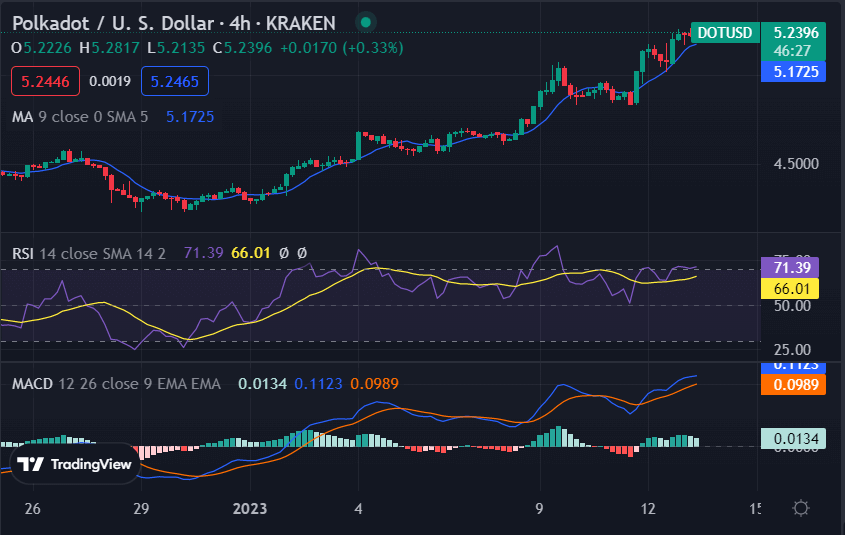
Polkadot price analysis 4-hour price chart: DOT set to achieve a new high
The 4-hours Polkadot price analysis is indicating a considerable rise in the price after a continuous bearish slope. The price has increased up to $5.27 which is a noteworthy improvement in the past hours. The moving average is at $5.17, just above the price level, with the SMA line below indicating a bearish trend.

The MACD is showing a bullish crossover, as the signal line is seen crossing the MACD line. This indicates that bulls are likely to take control of the market and propel the price further up. The RSI is in the positive zone, with values above 50 suggesting that the buyers are now dominating the market.
Polkadot price analysis conclusion
From the above 4-hours and 1-day Polkadot price analysis, it can be confirmed that the market is more welcoming for buyers. There are more buyers expected to proceed with their deals, and take the price above $5.28 as a result of more selling records.


