Polkadot price analysis is bullish, with the DOT/USD pair rising to the $7.04 level. However, the digital asset is facing resistance and may pull back to test support at $6.75. The price action recently created a bullish engulfing candlestick pattern, which indicates that the bears are losing control. Resistance for the DOT/USD is present at $7.23 A breakout above this level could see Polkadot target the next resistance level at $7.50. On the other hand, a failure to move past $7.23 may see the price pull back to test support at $6.75.
The top Cryptocurrencies are also trading in the green today, with Ethereum and Bitcoin both climbing higher. This is contributing to the bullish momentum for Polkadot. The market cap for Polkadot currently stands at $7.98 billion, with a 24-hour trading volume of $584 million.
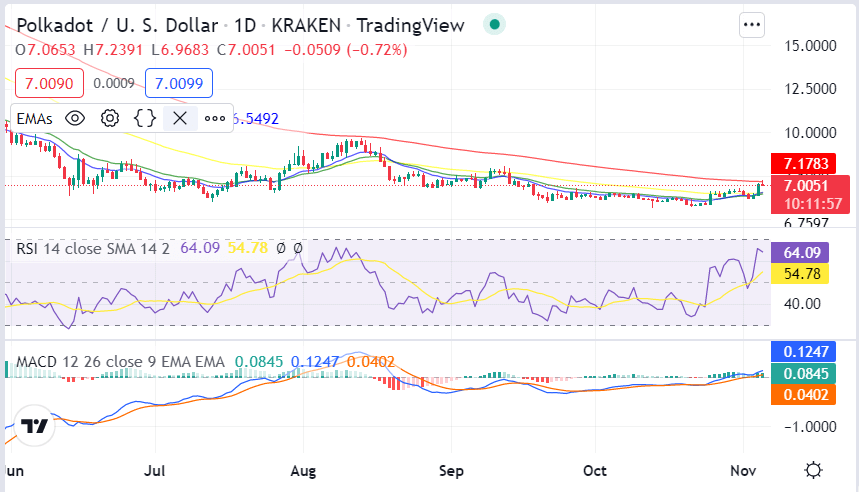
Polkadot price analysis 1-day price chart: DOT/USD gains 3.98 Percent in the last 24 hours
On the 1-day Polkadot price analysis chart, we can see that the price is currently in a breakout zone between $6.75 and $7.23, with the digital asset currently trading at the upper end of this zone. The DOT/USD has gained 3.98 percent in the last 24 hours and is currently trading at the $7.04 level. Today being the second day of gains, indicates that the bulls are in control and further price increases may be seen in the near term.

The Exponential Moving Averages 50 and 200 are both providing support for the Polkadot price, with the 50 EMA at $6.90 and the 200 EMA at $6.62. The RSI is currently at 54.78 and is rising, indicating that the Polkadot price is in bullish territory. However, it is approaching overbought levels, which could see the bulls take a break and allow the bears to take control of the market. The MACD is also in bullish territory and is rising, indicating that the bulls have the momentum to push the price higher.
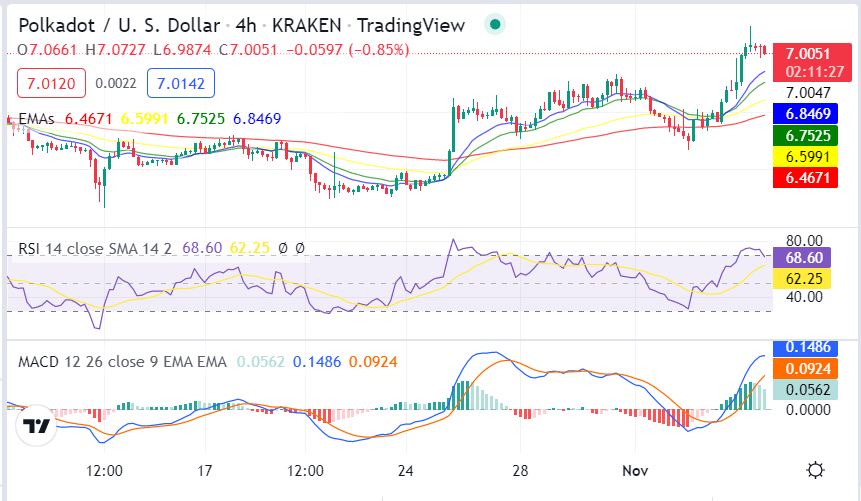
Polkadot price action on a 4-hour price chart: Latest developments
On the 4-hour Polkadot price analysis chart, we can see that the DOT price is currently in a bullish trend. The prices are trading along with the ascending channel and a breakout from the current range could set the tone for the next move.

The rise in prices has also seen the DOT/USD pair move above the 50 and 200 EMAs, indicating that bullish momentum is present. The MACD line in blue is above the signal line in red, indicating that the bulls have the momentum to push the prices higher. The RSI is currently moving in the overbought region, which indicates that the prices are due for a correction.
Polkadot price analysis conclusion
In conclusion, Polkadot price analysis shows a slightly bullish trend in the market. The digital asset is currently trading at a critical junction and a breakout from either side of the range could set the tone for the next move. The bulls need to be careful as a bearish move could invalidate the bullish trend. However, investors could look to buy on dips as the overall trend is bullish.
Disclaimer. The information provided is not trading advice. Cryptopolitan.com holds no liability for any investments made based on the information provided on this page. We strongly recommend independent research and/or consultation with a qualified professional before making any investment decisions.


