Polkadot price analysis shows DOT prices are still in a bearish market as they dip further to lows of $6.48. Polkadot price has been struggling to break past the resistance level at $6.71 and continues to face downward pressure. However, support for DOT is present at $6.48 and could potentially help stop further declines in price.
The bulls were in control of the market at the start of today’s trading session but faced selling pressure in the latter half. This can be attributed to the overall bearish sentiment in the market as cryptocurrencies continue to struggle with regulatory concerns and uncertainty.
DOT/USD 1-day price movement: Bears mount more pressure
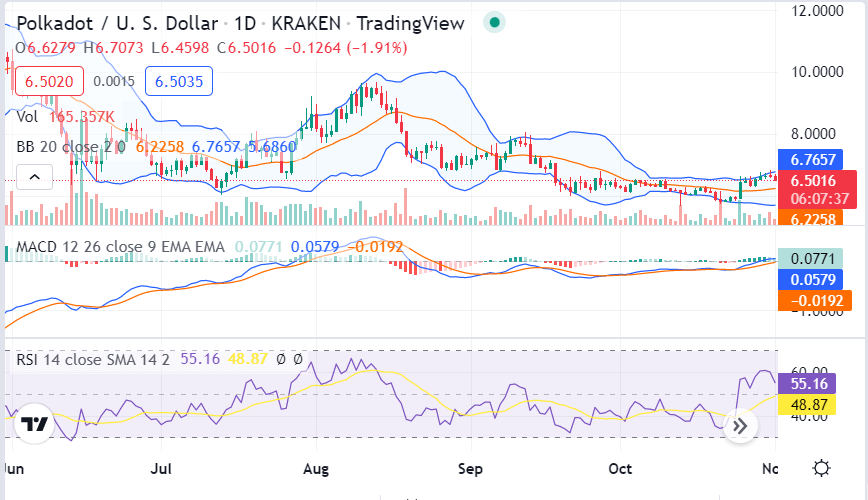
Polkadot price analysis indicates the prices have been trading at around $6.48 to $6.71 for the last few hours. The Coin is down by 1.85% in the past 24 hours and has a market cap of $7.25 billion and a trading volume of $3278 million.

The technical indications are currently bearish for DOT. The RSI indicator is trading in the oversold region, which indicates that prices may see a rebound in the near term. However, the MACD indicator is still in the bearish zone and is currently declining. This indicates that the bearish momentum is still strong and that prices could continue to fall in the near term. The Bollinger bands are currently widening, which indicates increased volatility in the market.
DOT/USD 4-hour price analysis: Prices dip below the $6.71 resistance level
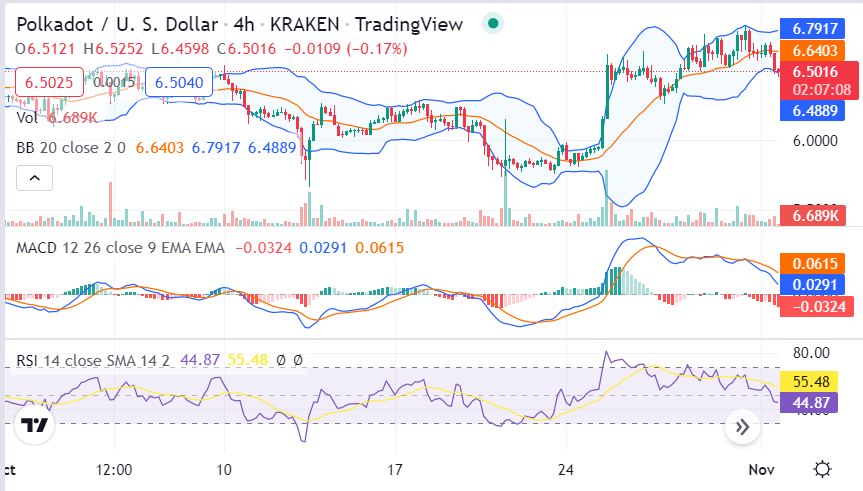
The hourly Polkadot price analysis shows that prices have dipped below the $6.71 resistance level and are currently trading at around $6.48. The next levels of resistance lie at $6.71. and a break above this level could potentially see prices rise toward the $7.00 mark. On the flip side, support for DOT/USD lies at $6.48 and a break below this level could see prices dip toward the $6.25 mark.

The 4-hour chart for DOT/USD shows that prices have been in a bearish trend since the beginning of the day as the MACD indicator is declining and the RSI indicator is trading in the oversold region. However, the bulls may potentially see a reversal in the near term as the MACD line is approaching a crossover with the signal line. The Upper Bollinger band is currently at $6.70 and the lower band is at $6.48, indicating that prices could continue to see volatile movement in the near term.
Polkadot price analysis conclusion
To sum up the Polkadot price analysis, prices have dipped further to lows of $6.48 and are currently facing downward pressure. Both hourly and daily technical indicators are bearish, indicating that prices could continue to decline in the near term. However, there is potential for a bullish reversal if the bulls can break past the $6.71 resistance level and sustain higher prices.
Disclaimer. The information provided is not trading advice. Cryptopolitan.com holds no liability for any investments made based on the information provided on this page. We strongly recommend independent research and/or consultation with a qualified professional before making any investment decisions.


