The Polkadot price analysis reveals that bullish momentum is on the go. The price of DOT/USD started to rise later yesterday, and the bulls are successfully continuing their endeavor today as well, as the price has increased significantly over the past few hours. The short-term price trend is still downwards if observed after 28 May 2022 as the coin’s value has been continuously improving, except for a stronger correction observed after 11 September 2022. The next resistance for DOT is present at $7.18, which is a little above the current price level, and the selling pressure may appear as the price nears the said resistance mark.
DOT/USD 1-day price chart: A recovery of 1.33 percent noted in DOT value
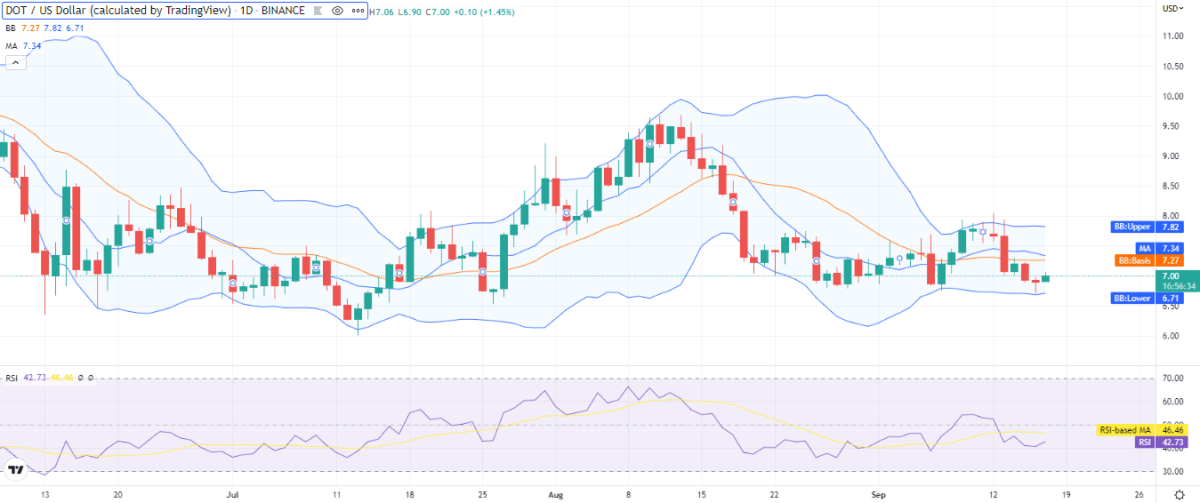
The 1-day price chart for the Polkadot price analysis shows that the price has increased today as bulls have taken the lead. The coin is trading at $7.0 at the time of writing. Due to the recovery process initiated for the bulls, the crypto pair is reporting a 1.33 percent increase in value for the last 24 hours. But the cryptocurrency is in a loss of 10.23 percent in value over the past week. At the same time, the trading volume has decreased by 11.71 percent, resulting in market dominance of 0.81 percent.

The volatility is mild as the Bollinger bands show the following readings, the upper band is at the $7.82 mark representing resistance for the coin, and the lower band is at the $6.71 mark representing the strongest support level, the mean average of the indicator is at $7.27. The moving average (MA) is at $7.34 above the SMA 50 curve but is slowly moving downwards.
The relative strength index (RSI) is on an upwards curve in the lower half of the neutral zone, trading at index 42. The RSI is on an upwards curve, hinting at the bullish momentum and buying activity in the market.
Polkadot price analysis: Recent developments and further technical indications
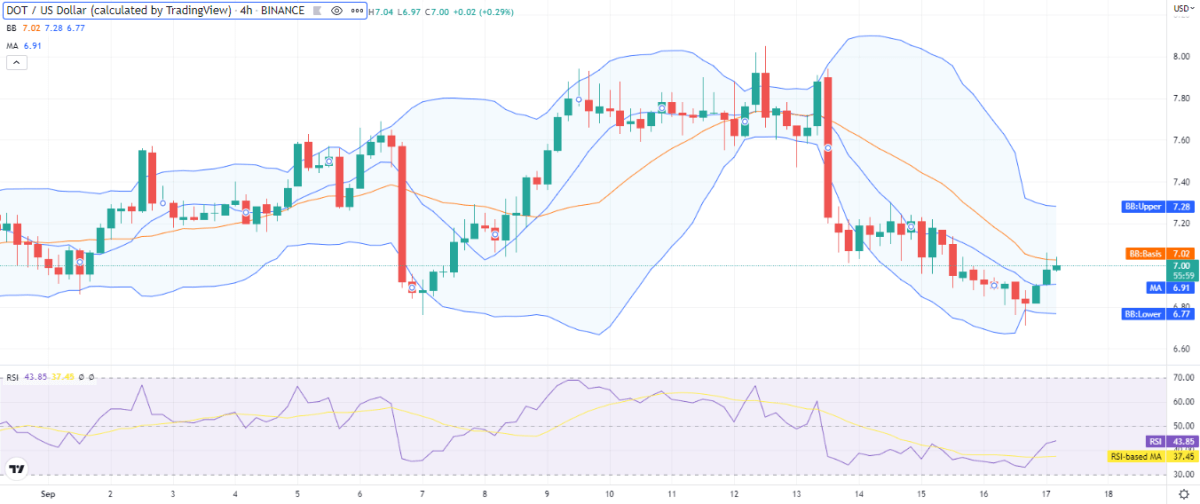
The 4-hour Polkadot price analysis shows that the price function has been following an upward trend for the last 12 hours, as bulls took charge later yesterday. Previously DOT was on a downtrend for the past few days. Today no bearish hindrance has been observed as green candlesticks are appearing on the 4-hour chart.

The volatility is also high on the hourly chart, the upper limit of the Bollinger bands is at $7.28, and the lower limit is at $6.77. The MA is also trading below the current price level on the 4-hour chart at $6.91. The RSI is trading at a slightly upward curve as its curve became milder recently; this horizontal movement of the indicator hints at a bearish presence above this point as well. However, the curve is upward, hinting at bulls yet in a more dominant position as compared to bears.
The technical indicators for DOT are mostly giving bearish hints, as the trend was strongly bearish previously. There is only one technical indicator supporting the bullish side and 15 indicators supporting the bearish side, while the remaining 10 technical indicators stand neutral out of a total of 26 technical indicators available for Polkdot price analysis.
Polkadot price analysis conclusion
The Polkadot price analysis suggests that the coin is in bullish momentum after yesterday’s correction, though the RSI curve is getting flat, which shows weakness in bullish momentum; however, the price has increased today, and a further improvement in cryptocurrency price is also possible if the bullish sentiment continues.
Disclaimer. The information provided is not trading advice. Cryptopolitan.com holds no liability for any investments made based on the information provided on this page. We strongly recommend independent research and/or consultation with a qualified professional before making any investment decisions.


