Polkadot price analysis is bearish today, as the cryptocurrency has faced a sharp decline at $5.84 earlier today. The bullish trend was seen battling for dominance throughout the day, however, the $5.83 psychological support level proved to be crucial for DOT, as it ultimately drove the price down. The market opened at $5.91, but it quickly fell to lows of $5.83, which was a drop of roughly 1.62%.
The digital asset has a 24-hour trading volume of $164 million and is currently sitting at number 11 on the coinmarketcap rankings, and having a market cap of $6.628 billion.
Polkadot price analysis: DOT price breaches $5.83 support on a daily chart
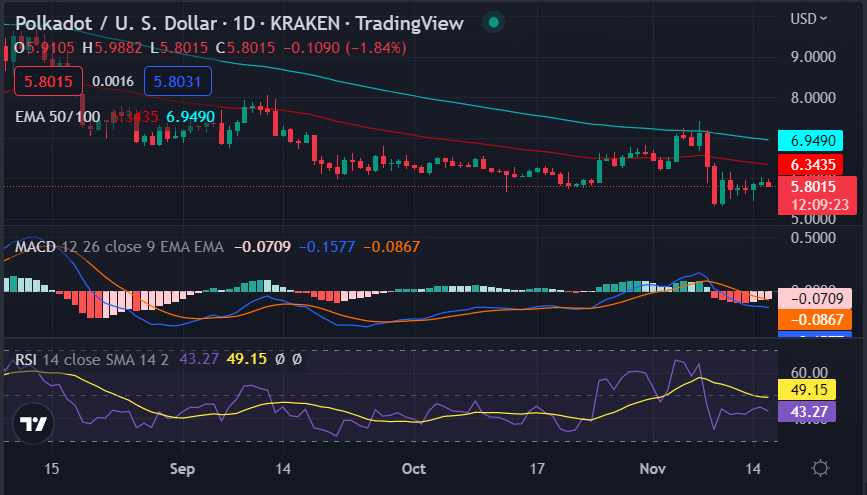
On the 24-hour candlestick chart for Polkadot price analysis, the price can be seen going down a significant decline after forming a reversal yesterday. LTC trended upwards as high as $6.02, but the price failed to break past that level and fell rapidly toward $5.83. Support was found at $5.83, but the price is struggling to climb back up it. if the price continues to decline, more support can be expected at $5.77, and if it breaks this level, then further support can be found at $5.72.

DOT price fell below the crucial 50-day exponential moving average (EMA) at $6.34, over the past 24 hours and the 100-day EMA is currently in place at $6.94, which offers strong resistance to the price increase. The 24-hour relative strength index (RSI) shows an abruptly declining market valuation at 49.15 which is heading further downwards. Meanwhile, the moving average convergence divergence (MACD) curve can be seen forming lower lows and heading toward a bearish divergence.
Polkadot price analysis: DOT price heads downward In the 4-hour time frame.
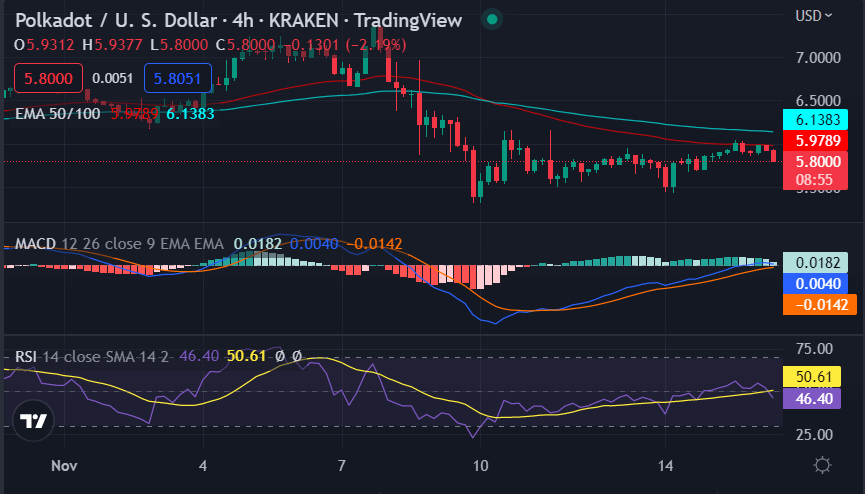
The 4-hour price chart for Polkadot price analysis shows the price has covered a steep downward movement in the starting four hours of today’s trading session as the bearish momentum has been trending over the market. The drop in price was quite drastic as the price levels decreased rapidly. However, the bulls seem to take control of the market if the price pushes above the $6.03 resistance level. However, the price is still below the lower limit of the volatility indicator.

The 50-day exponential moving average (EMA) is at $5.97, while the 100-day EMA is at $6.13. The 4-hour RSI indicator shows a declining market valuation approaching the oversold region at 50.61 and heading further downwards. The MACD indicator is still in a bearish position as the signal line is below the MACD line.
Polkadot price analysis conclusion
To sum up, Polkadot price analysis shows that the cryptocurrency faced a sharp decline in price earlier today as the price has dipped to $5.84 as of writing. Both one-day and hourly technical indicators show bearish sentiment for the digital asset, and it remains to be seen if the price can recover from this decline.
Disclaimer. The information provided is not trading advice. Cryptopolitan.com holds no liability for any investments made based on the information provided on this page. We strongly recommend independent research and/or consultation with a qualified professional before making any investment decisions.


